Live.log_sklearn_plot()
生成一个 scikit-learn 图表,并将数据保存至 {Live.dir}/plots/sklearn/{name}.json。
def log_sklearn_plot(
  kind: Literal['calibration', 'confusion_matrix', 'det', 'precision_recall', 'roc'],
  labels,
  predictions,
  name: Optional[str] = None,
  **kwargs):
用法
from dvclive import Live

with Live() as live:
  y_true = [0, 0, 1, 1]
  y_pred = [1, 0, 1, 0]
  y_score = [0.1, 0.4, 0.35, 0.8]
  live.log_sklearn_plot("roc", y_true, y_score)
  live.log_sklearn_plot(
    "confusion_matrix", y_true, y_pred, name="cm.json")
描述
该方法将计算并输出指定 kind 的图表(参见 支持的图表类型),以兼容 dvc plots 的格式保存至 {Live.dir}/plots/sklearn/{name}。
同时,它还会存储提供的属性,以便由 Live.make_dvcyaml() 写入 plots 部分。以下示例代码会向 dvc.yaml 添加如下内容:
plots:
  - dvclive/plots/sklearn/roc.json:
      template: simple
      x: fpr
      y: tpr
      title: Receiver operating characteristic (ROC)
      x_label: False Positive Rate
      y_label: True Positive Rate
  - dvclive/plots/sklearn/cm.json:
      template: confusion
      x: actual
      y: predicted
      title: Confusion Matrix
      x_label: True Label
      y_label: Predicted Label
支持的图表
kind 必须是以下支持的图表之一:
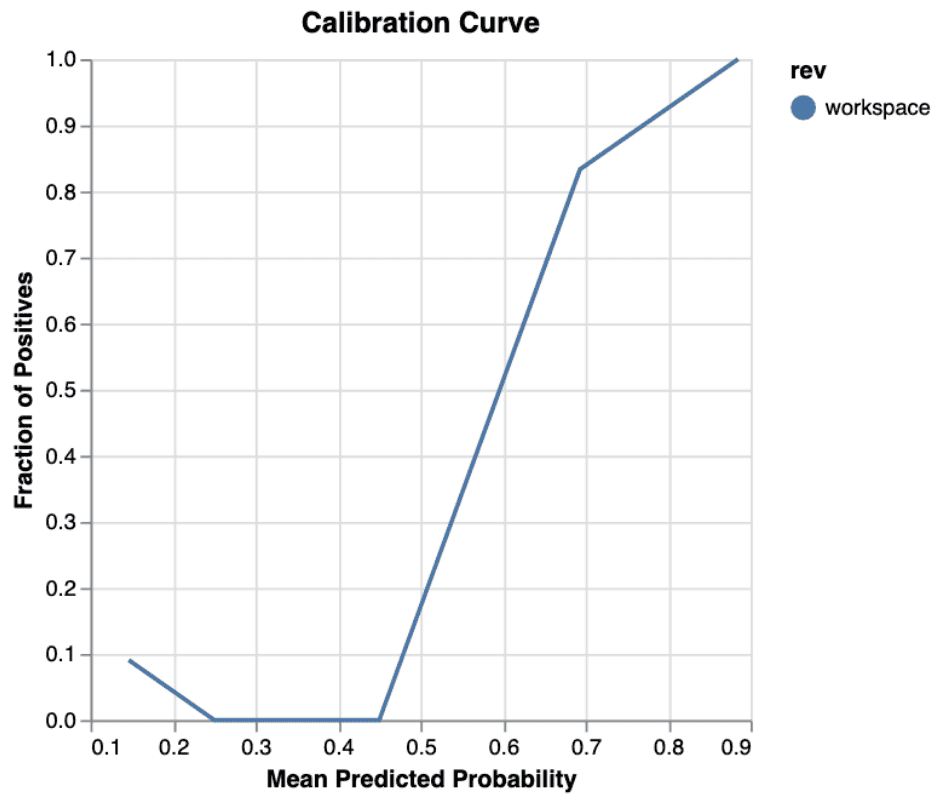
生成 校准曲线 图表。
y_true = [0, 0, 1, 1]
y_score = [0.1, 0.4, 0.35, 0.8]
live.log_sklearn_plot("calibration", y_true, y_score)
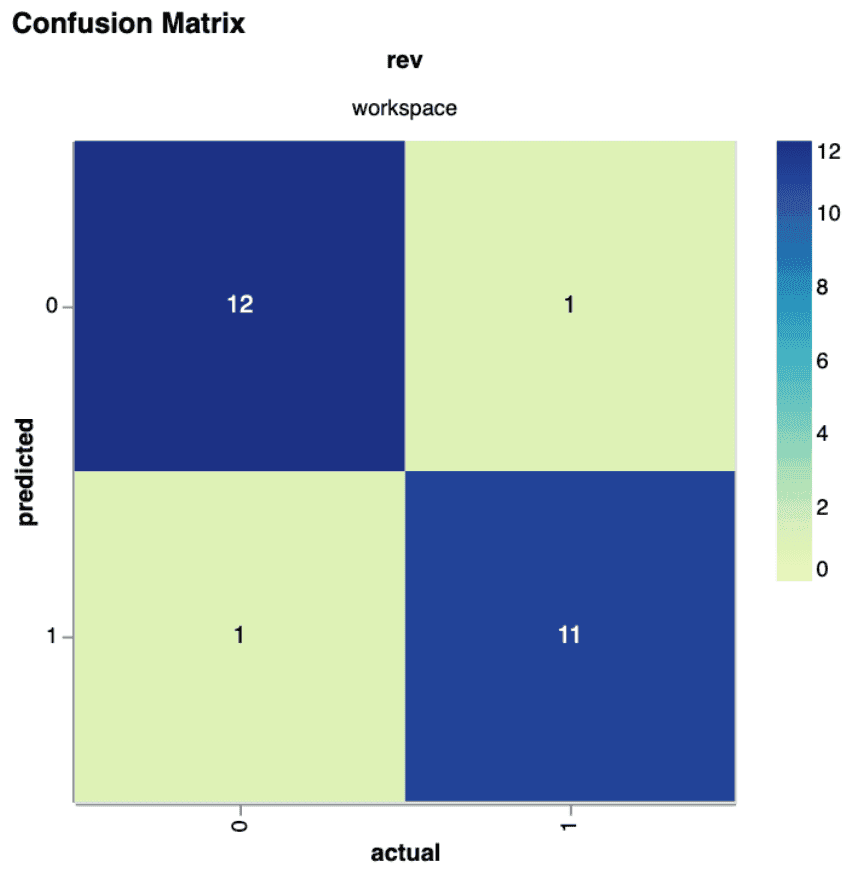
生成 混淆矩阵 图表。
y_true = [1, 1, 2, 2]
y_pred = [2, 1, 1, 2]
live.log_sklearn_plot("confusion_matrix", y_true, y_pred)
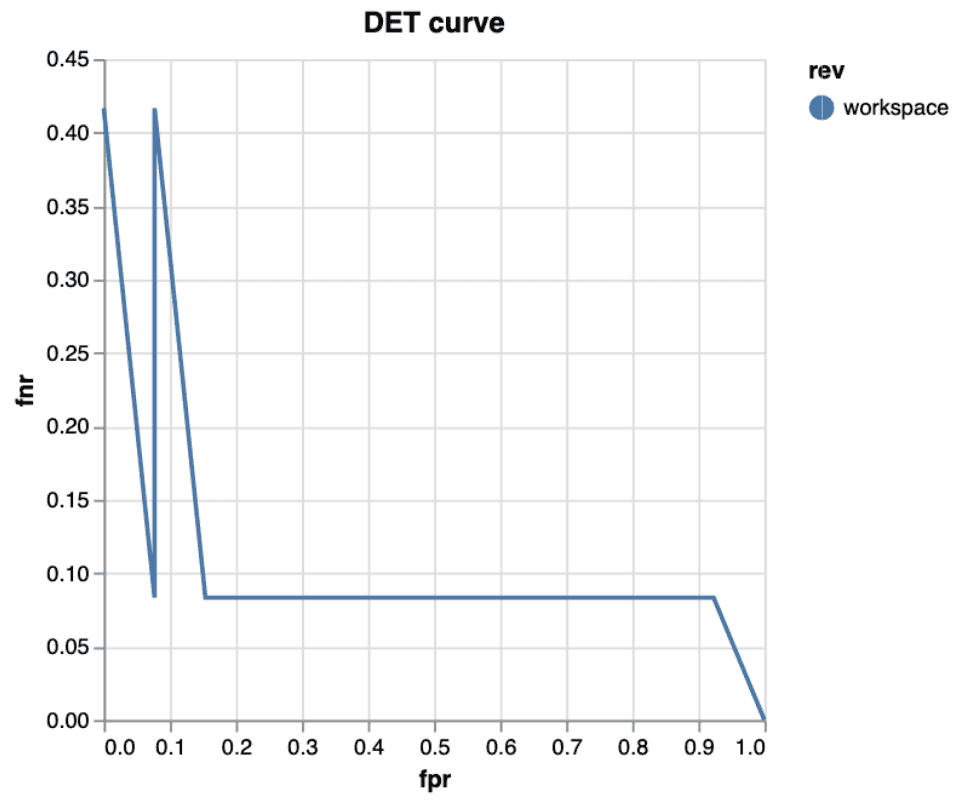
生成 检测误差权衡(DET) 图表。
y_true = [1, 1, 2, 2]
y_score = [0.1, 0.4, 0.35, 0.8]
live.log_sklearn_plot("det", y_true, y_score)
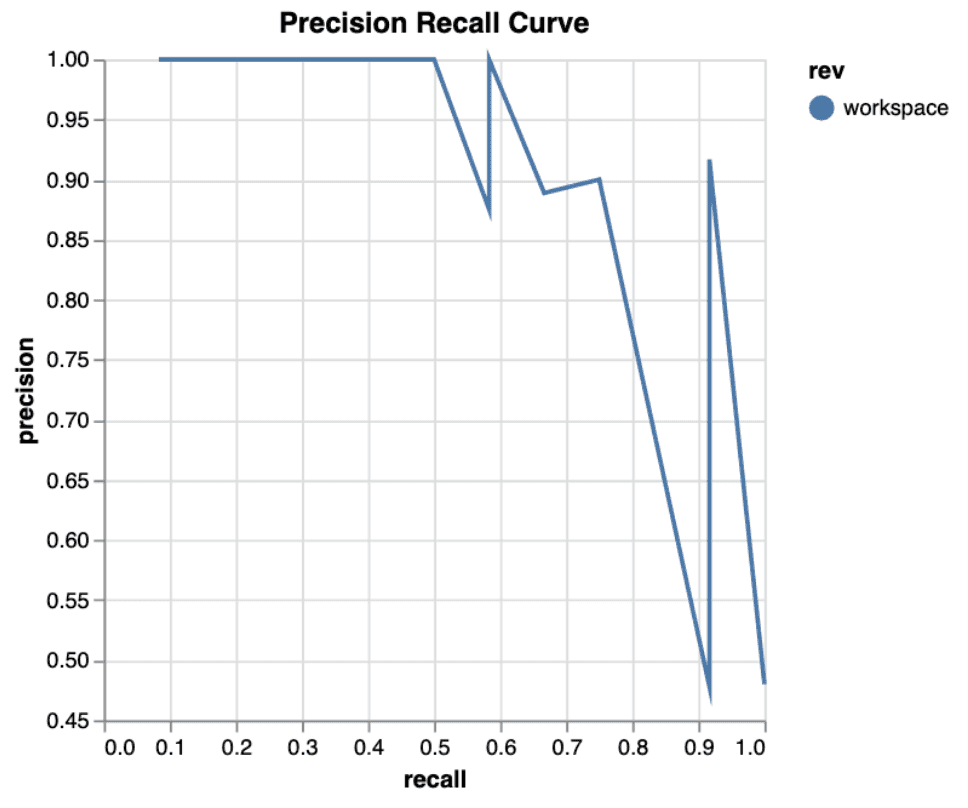
生成 精确率-召回率曲线 图表。
y_true = [1, 1, 2, 2]
y_score = [0.1, 0.4, 0.35, 0.8]
live.log_sklearn_plot("precision_recall", y_true, y_score)
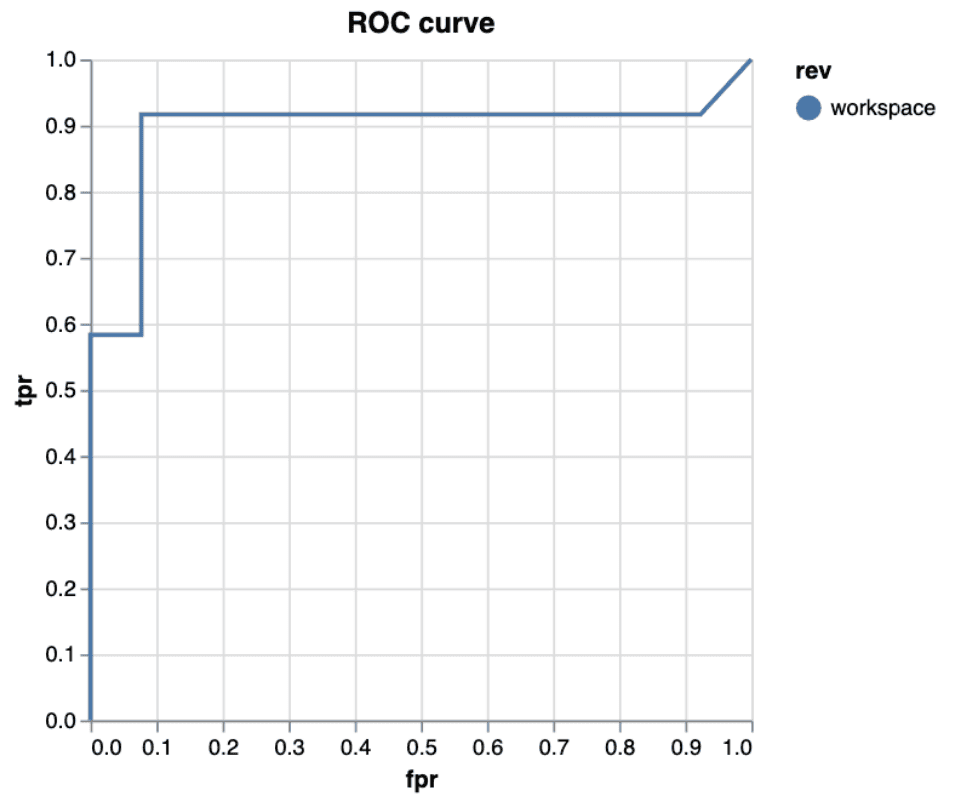
生成 接收者操作特征(ROC)曲线 图表。
y_true = [1, 1, 2, 2]
y_score = [0.1, 0.4, 0.35, 0.8]
live.log_sklearn_plot("roc", y_true, y_score)
参数
-
kind- 支持的图表类型。 -
labels- 真实标签的数组。 -
predictions- 预测标签的数组(用于confusion_matrix)或预测概率的数组(用于其他图表)。 -
name- 输出文件的可选名称。若未提供,则使用kind作为名称。 -
**kwargs- 用于调整结果的额外参数。这些参数将传递给 scikit-learn 函数(例如,roc类型可使用drop_intermediate=True)。此外,每种图表类型还支持以下额外参数:normalized- 默认值:False。将confusion_matrix的值归一化至<0, 1>范围内。
异常
dvclive.error.InvalidPlotTypeError- 当提供的kind不属于任何支持的图表类型时抛出。