Live.log_plot()
def log_plot(
    name: str,
    datapoints: pd.DataFrame | np.ndarray | List[Dict],
    x: str,
    y: Union[str, list[str]],
    template: Optional[str] = None,
    title: Optional[str] = None,
    x_label: Optional[str] = None,
    y_label: Optional[str] = None,
):
用法
from dvclive import Live
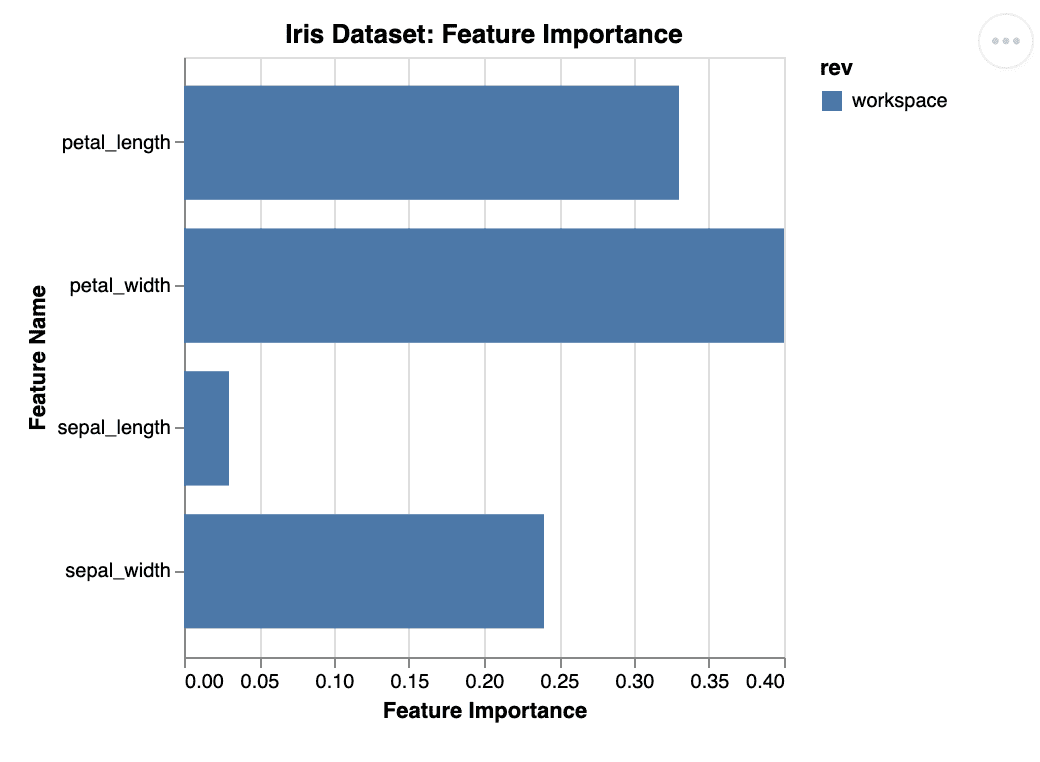
datapoints = [
{"name": "petal_width", "importance": 0.4},
{"name": "petal_length", "importance": 0.33},
{"name": "sepal_width", "importance": 0.24},
{"name": "sepal_length", "importance": 0.03}
]
with Live() as live:
live.log_plot(
"iris_feature_importance",
datapoints,
x="importance",
y="name",
template="bar_horizontal",
title="Iris Dataset: Feature Importance",
y_label="Feature Name",
x_label="Feature Importance"
)描述
该方法会将提供的 datapoints 输出至 {Live.dir}/plots/custom/{name}.json,并存储指定的属性,以便由 Live.make_dvcyaml() 写入到 plots 部分。
以下代码片段将生成如下 dvc.yaml:
plots:
  - dvclive/plots/custom/iris_feature_importance.json:
      template: bar_horizontal
      x: importance
      y: name
      title: 'Iris Dataset: Feature Importance'
      x_label: Feature Importance
      y_label: Feature Name
该图表可通过 DVC CLI、VSCode 扩展 或 DVC Studio 进行渲染。
参数
-
name- 输出文件的名称。 -
datapoints- 包含绘图数据的 Pandas DataFrame、Numpy 数组或字典列表。 -
x- 用作x轴的键名(存在于字典中)。 -
y- 用作y轴的键名或多个键名(存在于字典中)。 -
template- 使用的 DVC 绘图模板 名称。默认为linear。 -
title- 显示的标题。默认为{Live.dir}/plots/custom/{name}.json。 -
x_label-x轴的标签。默认为传入的x名称。 -
y_label-y轴的标签。默认为传入的y名称。
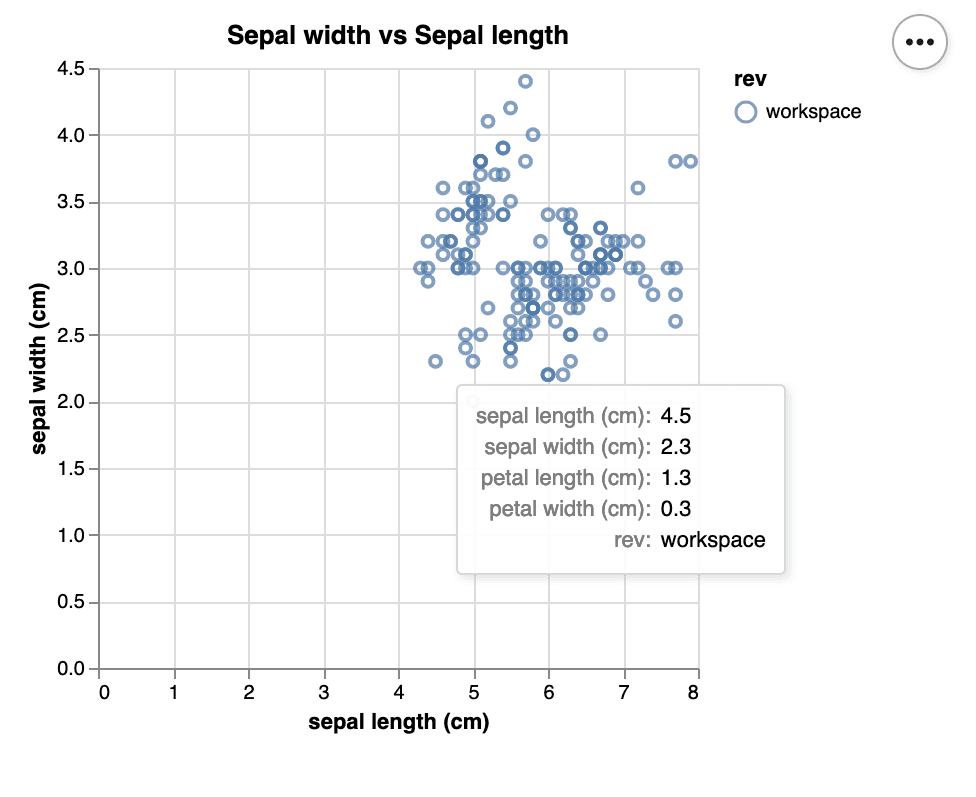
示例:从 Pandas DataFrame 绘图
你可以从 Pandas DataFrame 格式绘制数据:
import pandas as pd
from dvclive import Live
from sklearn.datasets import load_iris

iris = load_iris()
datapoints = pd.DataFrame(data=iris.data, columns=iris.feature_names)

with Live() as live:
    live.log_plot(
        "sepal",
        datapoints,
        x="sepal length (cm)",
        y="sepal width (cm)",
        template="scatter",
        title="Sepal width vs Sepal length")
以下代码片段将生成如下 dvc.yaml:
plots:
  - dvclive/plots/custom/sepal.json:
      template: scatter
      x: sepal length (cm)
      y: sepal width (cm)
      title: Sepal width vs Sepal length
渲染后的图表:
示例:从 Numpy 数组绘图
DVCLive 支持具有命名列的结构化 Numpy 数组,用于描述性数据可视化,也支持无命名列的非结构化数组,用于简单的数值绘图。
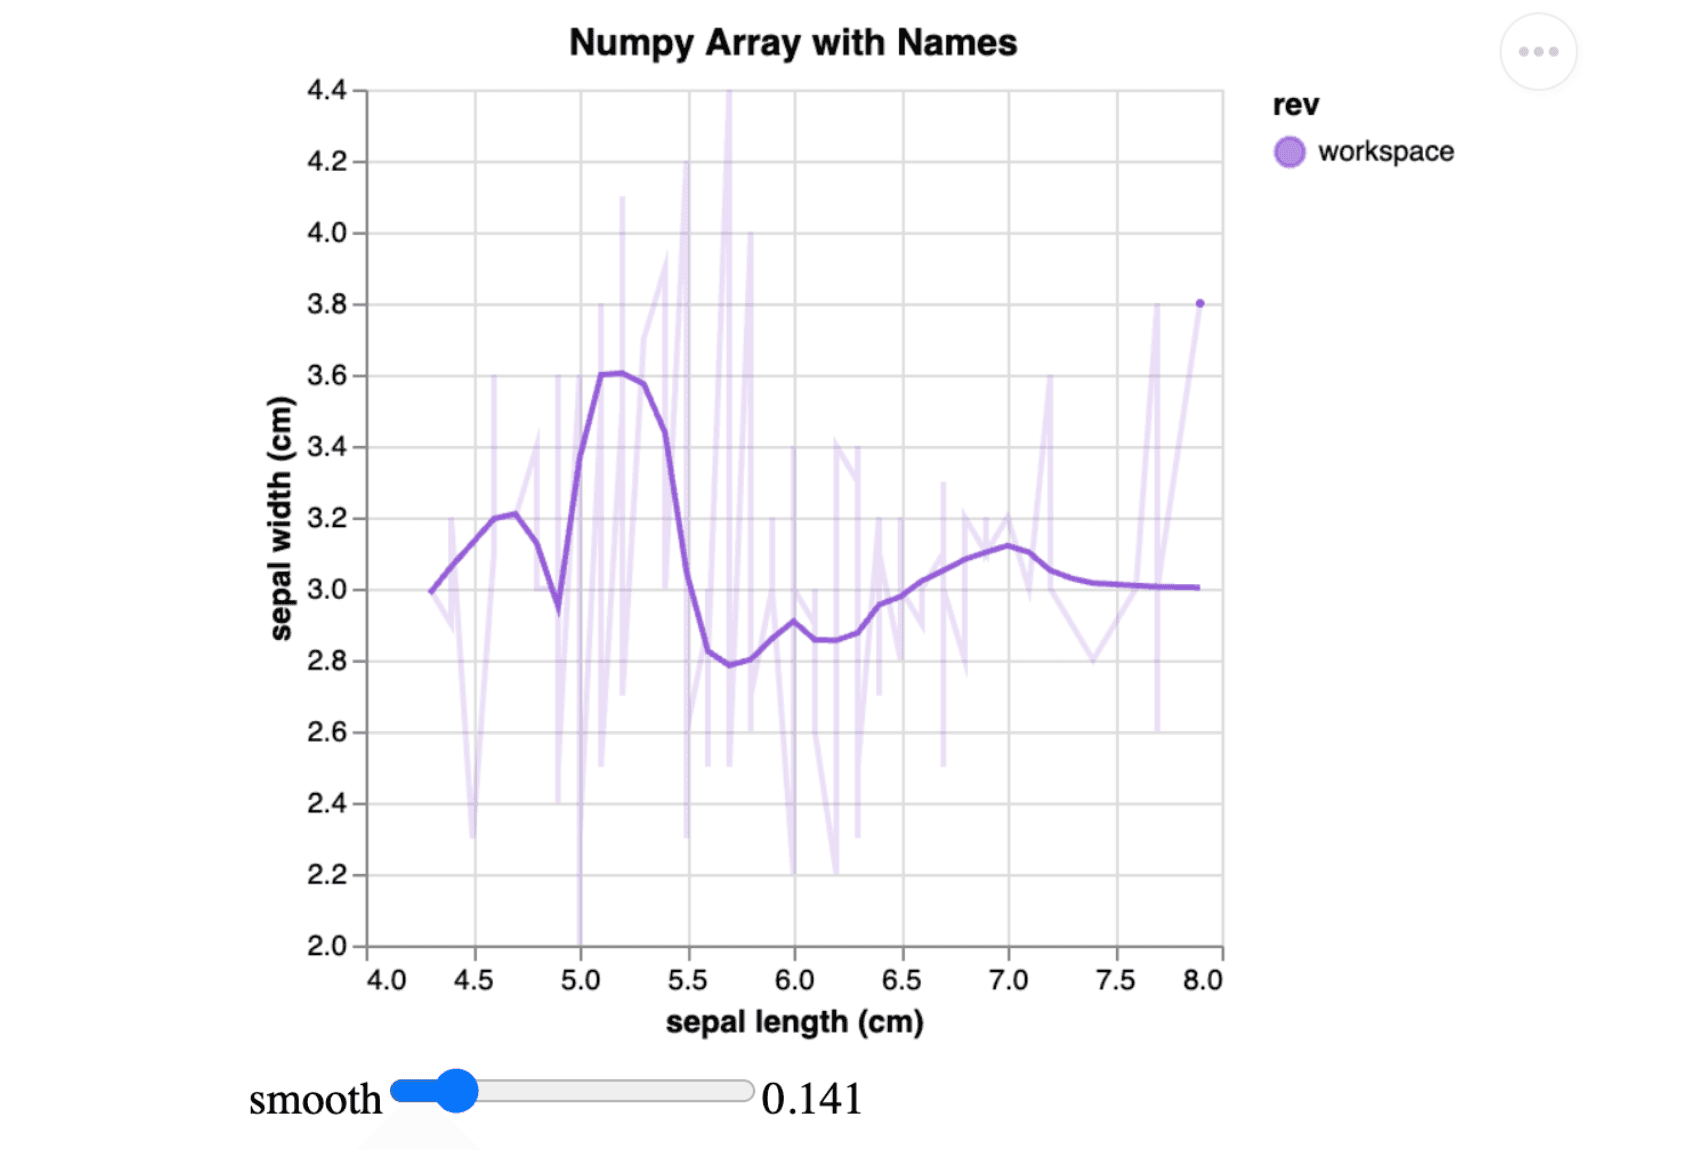
结构化 Numpy 数组示例
本示例中加载了鸢尾花数据集,并将其转换为结构化 Numpy 数组。每一列名均对应鸢尾花数据集的一个特征。
import numpy as np
from dvclive import Live
from sklearn.datasets import load_iris

# Create a structured array
iris = load_iris()
dtypes = [(name, float) for name in iris.feature_names]
data = np.array([tuple(row) for row in iris.data], dtype=dtypes)

with Live() as live:

    live.log_plot(
        "sepal_array_named",
        data,
        x="sepal length (cm)",
        y="sepal width (cm)",
        template="smooth",
        title="Numpy Array with Names"
    )
log_plot() 方法生成一个 smooth 图表,X 和 Y 的标签会自动从列名中提取。
以下代码片段将生成如下 dvc.yaml:
plots:
  - dvclive/plots/custom/sepal_array_named.json:
      template: smooth
      x: sepal length (cm)
      y: sepal width (cm)
      title: Numpy Array with Names
渲染后的图表:
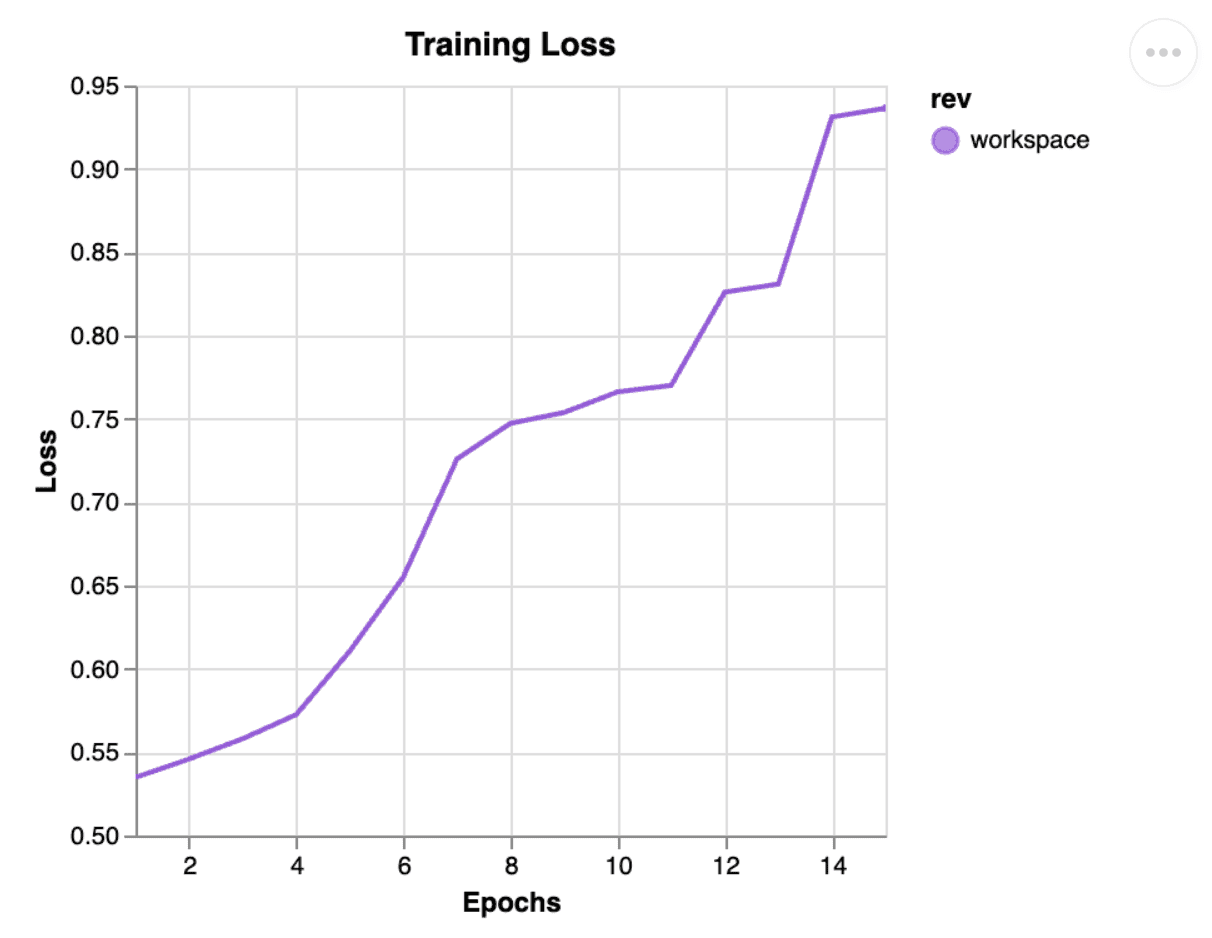
非结构化 Numpy 数组示例
本示例使用一个无命名列的双列数组可视化训练损失随轮次的变化。对于此类非结构化数组,DVCLive 会以数字索引方式标记列,如 "0"、"1" 等。
import numpy as np
from dvclive import Live

# Create an unstructured array
epochs = np.arange(1, 16)
values = np.sort(np.random.uniform(0.45, 0.965, 15))
data = np.column_stack((epochs, values))

with Live() as live:
    live.log_plot(
        "training_loss_plot",
        data,
        x="0",
        y="1",
        template="linear",
        title="Training Loss",
        x_label="Epochs",
        y_label="Loss"
    )
log_plot() 方法生成一个名为“Training Loss”的线性图表,并使用提供的标签命名 x 轴和 y 轴。
以下代码片段将生成如下 dvc.yaml:
plots:
  - dvclive/plots/custom/training_loss_plot.json:
      template: linear
      x: '0'
      y: '1'
      title: Training Loss
      x_label: Epochs
      y_label: Loss
通过 dvc plots 渲染:
异常
-
dvclive.error.InvalidDataTypeError- 当提供的datapoints类型不受支持时抛出。支持的类型包括:pd.DataFrame | np.ndarray | List[Dict]