注意
本文档适用于 Ceph 开发版本。
Ceph 仪表板
概述
The Ceph Dashboard is a web-based Ceph management-and-monitoring tool that can be used to inspect and administer resources in the cluster. It is implemented as aCeph 管理守护进程模块。
The original Ceph Dashboard shipped with Ceph Luminous and was a simple
TheCeph 仪表板module adds web-based monitoring and administrationopenATTIC Ceph management and monitoring tool. Development was originally driven by the openATTICSUSE, with support from members of the CephRed Hat.
The dashboard module’s backend code uses the CherryPy framework, and implementsceph-mgr.
功能概述
The dashboard provides the following features:
Multi-User and Role Management: The dashboard supports multiple user用户和角色管理for details.
Single Sign-On (SSO): The dashboard supports authentication启用单点登录 (SSO)for details.
SSL/TLS support: All HTTP communication between the web browser and theSSL/TLS 支持说明for details.
Auditing: The dashboard backend can be configured to log all
PUT,POST和DELETEAPI requests in the Ceph audit log. See审计 API 请求for instructions on how to enable this feature.Internationalization (I18N): The language used for dashboard text can be
The Ceph Dashboard offers the following monitoring and management capabilities:
Overall cluster health: Display performance and capacity metrics as well
Embedded Grafana Dashboards: Ceph DashboardGrafanadashboards may be embedded in external applications and web pagesPrometheus 模块module. See启用 Grafana 仪表板的嵌入for details on how to configure this functionality.
Cluster logs: Display the latest updates to the cluster’s event and
Hosts: Display a list of all cluster hosts along with their
Performance counters: Display detailed service-specific statistics for
Monitors: List all Mons, their quorum status, and open sessions.
Monitoring: Enable creation, re-creation, editing, and expiration of
Configuration Editor: Display all available configuration options,
Pools: List Ceph pools and their details (e.g. applications,
OSDs: List OSDs, their status and usage statistics as well as
Device management: List all hosts known by the orchestrator. List all
iSCSI: List all hosts that run the TCMU runner service, display all
ceph-iscsi). Display the启用 iSCSI 管理for instructions on how to configureRBD: List all RBD images and their properties (size, objects, features).
RBD mirroring: Enable and configure RBD mirroring to a remote Ceph server.
CephFS: List active file system clients and associated pools,
Object Gateway: List all active object gateways and their performance启用对象网关管理前端for configuration instructions.
NFS: Manage NFS exports of CephFS file systems and RGW S3 buckets via NFSNFS-Ganesha 管理for details on how to
Ceph Manager Modules: Enable and disable Ceph Manager modules, manage
Dashboard 登录页面概述
The landing page of Ceph Dashboard serves as the home page and features metrics
注意
You can change the landing page to the previous version from:Cluster >> Manager Modules >> Dashboard >> Edit.FEATURE_TOGGLE_DASHBOARDoption will change the landing page, from one view to another.
Note that the previous version of the landing page will be disabled in future releases.
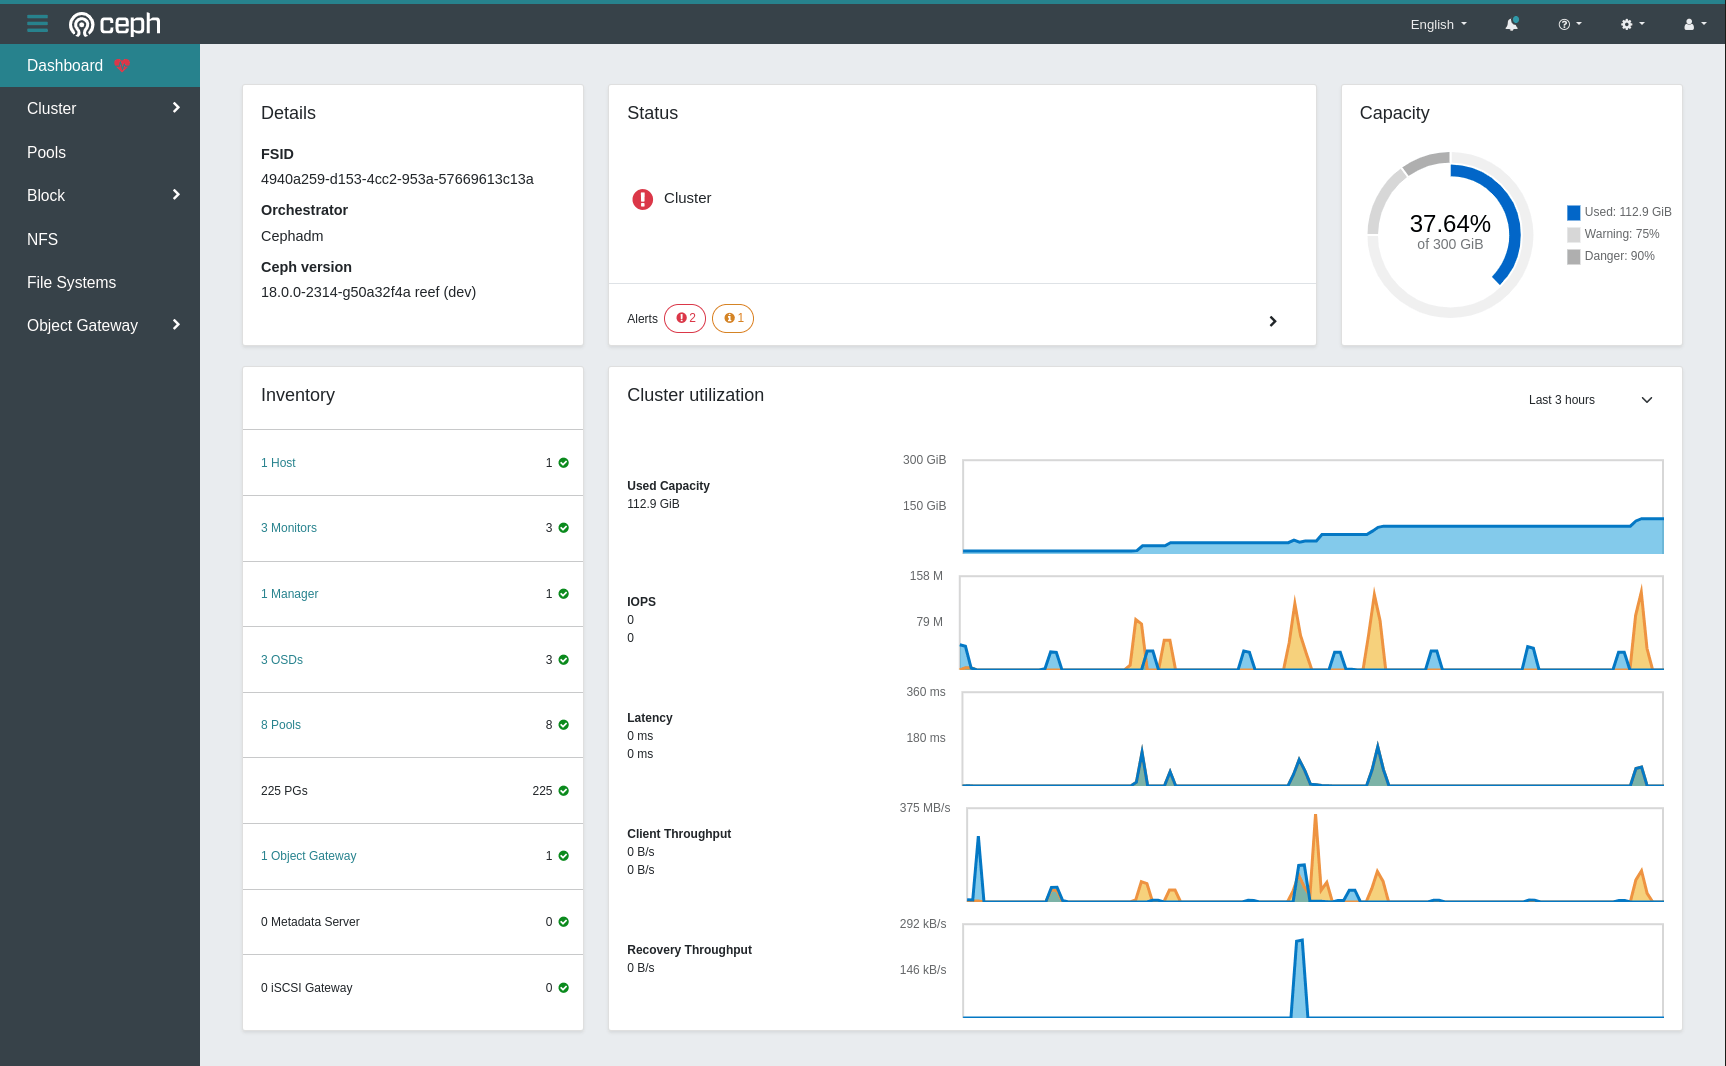
详细信息
Provides an overview of the cluster configuration, displaying various critical aspects of the cluster.
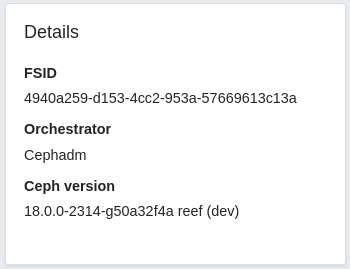
状态
Provides a visual indication of cluster health, and displays cluster alerts grouped by severity.
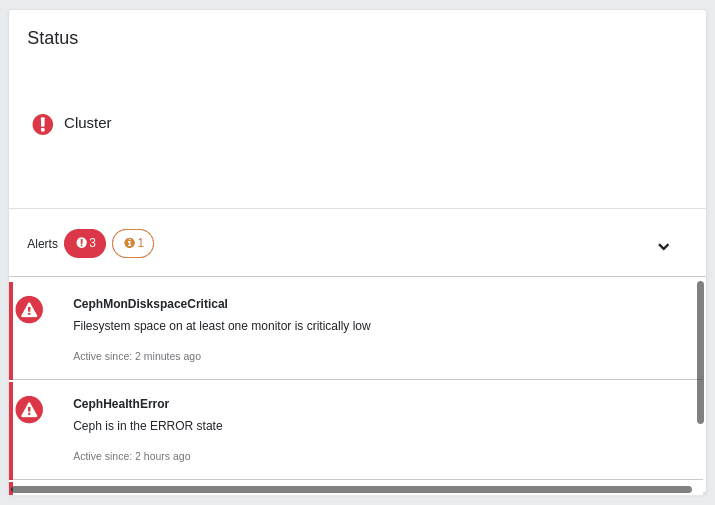
容量
Used: Displays the used capacity out of the total physical capacity provided by storage nodes (OSDs)
警告: Displays thenearfullthreshold of the OSDs
Danger: Displays thefullthreshold of the OSDs
库存
An inventory for all assets within the cluster.

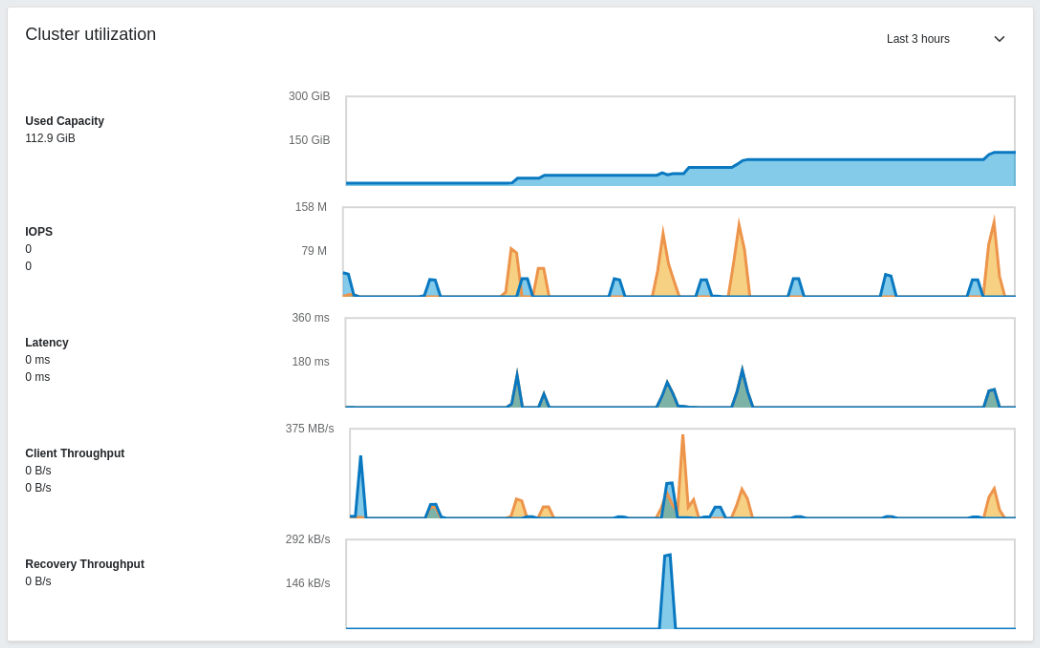
集群利用率
Used Capacity: Total capacity used of the cluster. The maximum value of the chart is the maximum capacity of the cluster.
IOPS (Input/Output Operations Per Second): Number of read and write operations.
Latency: Amount of time that it takes to process a read or a write request.
Client Throughput: Amount of data that clients read or write to the cluster.
Recovery Throughput: Amount of recovery data that clients read or write to the cluster.
支持的浏览器
Ceph Dashboard is primarily tested and developed using the following web
Browser |
Versions |
|---|---|
latest 2 major versions |
|
latest 2 major versions |
|
latest major version |
While Ceph Dashboard might work in older browsers, we cannot guarantee compatibility and
启用
If you have installedceph-mgr-dashboardfrom distribution packages, the
If you’re building Ceph from source and want to start the dashboard from yourREADME.rst和HACKING.rstin the source directorysrc/pybind/mgr/dashboard.
Within a running Ceph cluster, the Ceph Dashboard is enabled with:
ceph mgr module enable dashboard
配置
SSL/TLS 支持说明
All HTTP connections to the dashboard are secured with SSL/TLS by default.
To get the dashboard up and running quickly, you can generate and install a
ceph dashboard create-self-signed-cert
Note that most web browsers will complain about self-signed certificates
To properly secure a deployment and to remove the warning, a
For example, a key pair can be generated with a command similar to:
openssl req -new -nodes -x509 \
-subj "/O=IT/CN=ceph-mgr-dashboard" -days 3650 \
-keyout dashboard.key -out dashboard.crt -extensions v3_ca
Thedashboard.crtfile should then be signed by a CA. Once that is done, you
ceph dashboard set-ssl-certificate -i dashboard.crt
ceph dashboard set-ssl-certificate-key -i dashboard.key
If unique certificates are desired for each manager instance,$nameis the nameceph-mgrinstance, usually the hostname):
ceph dashboard set-ssl-certificate $name -i dashboard.crt
ceph dashboard set-ssl-certificate-key $name -i dashboard.key
SSL can also be disabled by setting this configuration value:
ceph config set mgr mgr/dashboard/ssl false
This might be useful if the dashboard will be running behind a proxy which does代理配置for more details.
警告
Use caution when disabling SSL as usernames and passwords will be sent to the
注意
You must restart Ceph manager processes after changing the SSLceph mgr
fail mgror by disabling and re-enabling the dashboard module (which also
ceph mgr module disable dashboard
ceph mgr module enable dashboard
主机名和端口
Like most web applications, the dashboard binds to a TCP/IP address and TCP port.
默认情况下,ceph-mgrdaemon hosting the dashboard (i.e., the currently
If no specific address has been configured, the web app will bind to::,
These defaults can be changed via the configuration key facility on a
ceph config set mgr mgr/dashboard/server_addr $IP
ceph config set mgr mgr/dashboard/server_port $PORT
ceph config set mgr mgr/dashboard/ssl_server_port $PORT
Since eachceph-mgrhosts its own instance of the dashboard, it may be
ceph config set mgr mgr/dashboard/$name/server_addr $IP
ceph config set mgr mgr/dashboard/$name/server_port $PORT
ceph config set mgr mgr/dashboard/$name/ssl_server_port $PORT
将$namewith the ID of the ceph-mgr instance hosting the dashboard.
注意
The commandceph mgr serviceswill show you all endpoints that aredashboardkey to obtain the URL for
用户名和密码
In order to be able to log in, you need to create a user account and associate系统角色 that you can use. For more details please refer to the 用户和角色管理部分。
To create a user with the administrator role you can use the following commands:
ceph dashboard ac-user-create <username> -i <file-containing-password> administrator
账户锁定
It disables a user account if a user repeatedly enters the wrong credentials for multiple times. It is enabled by default to prevent brute-force or dictionary attacks. The user can get or set the default number of lock-out attempts using these commands respectively:
ceph dashboard get-account-lockout-attempts
ceph dashboard set-account-lockout-attempts <value:int>
警告
This feature can be disabled by setting the default number of lock-out attempts to 0. However, by disabling this feature, the account is more vulnerable to brute-force or dictionary based attacks. This can be disabled by:
ceph dashboard set-account-lockout-attempts 0
启用被锁定的用户
If a user account is disabled as a result of multiple invalid login attempts, then it needs to be manually enabled by the administrator. This can be done by the following command:
ceph dashboard ac-user-enable <username>
访问 Dashboard
You can now access the dashboard using your (JavaScript-enabled) web browser, by
pointing it to any of the host names or IP addresses and the selected TCP port
where a manager instance is running: e.g., http(s)://<$IP>:<$PORT>/.
The dashboard page displays and requests a previously defined username and password.
启用对象网关管理前端
When RGW is deployed with cephadm, the RGW credentials used by the dashboard will be automatically configured. You can also manually force the credentials to be set up with:
ceph dashboard set-rgw-credentials
This will create an RGW user with uid dashboard for each realm in
the system.
If you’ve configured a custom ‘admin’ resource in your RGW admin API, you should set it here also:
ceph dashboard set-rgw-api-admin-resource <admin_resource>
If you are using a self-signed certificate in your Object Gateway setup, you should disable certificate verification in the dashboard to avoid refused connections, e.g. caused by certificates signed by unknown CA or not matching the host name:
ceph dashboard set-rgw-api-ssl-verify False
To set a custom hostname or address for an RGW gateway, set the value of RGW_HOSTNAME_PER_DAEMON
accordingly:
ceph dashboard set-rgw-hostname <gateway_name> <hostname>
The setting can be unset using:
ceph dashboard unset-rgw-hostname <gateway_name>
If the Object Gateway takes too long to process requests and the dashboard runs into timeouts, you can set the timeout value to your needs:
ceph dashboard set-rest-requests-timeout <seconds>
The default value is 45 seconds.
启用 iSCSI 管理
The Ceph Dashboard can manage iSCSI targets using the REST API provided by the
rbd-target-api service of the Ceph iSCSI Gateway. Please make sure that it is
installed and enabled on the iSCSI gateways.
注意
The iSCSI management functionality of Ceph Dashboard depends on the latest version 3 of the ceph-iscsi project. Make sure that your operating system provides the correct version, otherwise the dashboard will not enable the management features.
如果未设置ceph-iscsi REST API is configured in HTTPS mode and its using a self-signed
certificate, you need to configure the dashboard to avoid SSL certificate
verification when accessing ceph-iscsi API.
To disable API SSL verification run the following command:
ceph dashboard set-iscsi-api-ssl-verification false
The available iSCSI gateways must be defined using the following commands:
ceph dashboard iscsi-gateway-list
# Gateway URL format for a new gateway: <scheme>://<username>:<password>@<host>[:port]
ceph dashboard iscsi-gateway-add -i <file-containing-gateway-url> [<gateway_name>]
ceph dashboard iscsi-gateway-rm <gateway_name>
启用 Grafana 仪表板的嵌入
Grafana pulls data from Prometheus. Although Grafana can use other data sources, the Grafana dashboards we provide contain queries that are specific to Prometheus. Our Grafana dashboards therefore require Prometheus as the data source. The Ceph Prometheus 模块模块以 Prometheus 提示格式导出其数据。这些 Grafana 仪表板依赖于 Prometheus 模块的指标名称,并且节点导出器。节点导出器是一个单独的应用程序,它提供机器指标。
注意
组成。Prometheus 的安全模型假定不受信任的用户可以访问 Prometheus HTTP 端点和日志。不受信任的用户可以访问 Prometheus 数据库中收集的所有(元)数据,以及各种操作和调试信息。
然而,Prometheus 的 HTTP API 仅限于只读操作。配置可以使用 API 进行更改,并且秘密不会被公开。此外,Prometheus 拥有一些内置措施来减轻拒绝服务攻击的影响。firefly 发布。Firefly 将延迟至少另一个冲刺,以便我们可以对新代码进行一些操作经验,并进行一些额外的测试,然后再承诺长期支持。be changed using the API and secrets are not
请参阅Prometheus 的安全模型以获取更详细的信息。
使用 cephadm 进行安装和配置
Grafana 和 Prometheus 可以使用Cephadm。它们将cephadm。请参阅监控服务文档以获取有关如何使用cephadmfor installing and configuring Prometheus and Grafana 的更多详细信息。
手动安装和配置
以下过程描述了如何手动配置 Grafana 和 Prometheus。在您在适当的主机上安装了 Prometheus、Grafana 和 Node exporter 后,请执行以下步骤。
启用作为 Ceph 管理器模块提供的 Ceph Exporter,通过运行:
ceph mgr module enable prometheus更多详细信息可以在Prometheus 模块.
的文档中找到。
global:
  scrape_interval: 5s

scrape_configs:
  - job_name: 'prometheus'
    static_configs:
      - targets: ['localhost:9090']
  - job_name: 'ceph'
    static_configs:
      - targets: ['localhost:9283']
  - job_name: 'node-exporter'
    static_configs:
      - targets: ['localhost:9100']
注意
请注意,在上述示例中,Prometheus 配置为从自身(端口 9090)抓取数据,Ceph 管理器模块prometheus(端口 9283),它导出 Ceph 内部数据,以及 Node exporter(端口 9100),它为每个主机提供操作系统和硬件指标。34ca36: 根据您的配置,您可能需要更改
Depending on your configuration, you may need to change the hostname in
此外,您不需要need为 Ceph 特定数据设置多个目标,由prometheusmgr 模块提供。但建议配置 Prometheus 从所有现有的 Ceph 管理器抓取 Ceph 特定数据。这启用了一种内置的高可用机制,因此如果 Ceph 管理器宕机,则运行在管理器主机上的服务将自动在另一个管理器主机上重新启动。
将 Prometheus 作为数据源添加到 Grafana使用 Grafana Web UI.
重要
数据源必须命名为“Dashboard1”。
安装vonage-status-panel 和 grafana-piechart-panel 插件使用:plugins using:
grafana-cli plugins install vonage-status-panel
grafana-cli plugins install grafana-piechart-panel
添加 Dashboard 到 Grafana:
可以通过导入 Dashboard JSON 文件将 Dashboard 添加到 Grafana。使用以下命令下载 JSON 文件:
wget https://raw.githubusercontent.com/ceph/ceph/main/monitoring/ceph-mixin/dashboards_out/<Dashboard-name>.json您可以在这里.
找到各种 Dashboard JSON 文件
wget https://raw.githubusercontent.com/ceph/ceph/main/monitoring/ceph-mixin/dashboards_out/ceph-cluster.json您也可以创建自己的 Dashboard。
在
/etc/grafana/grafana.ini:[auth.anonymous] enabled = true org_name = Main Org. org_role = Viewer
中配置匿名模式
allow_embedding的新设置。此设置必须显式设置为true才能启用 Ceph Dashboard 中的 Grafana 集成,因为默认值是false.[security] allow_embedding = true
启用 RBD-Image 监控
RBD 图像的监控默认情况下是禁用的,因为它可能会显著影响性能。更多信息请参阅Ceph 健康检查。
配置 Dashboard
在您设置好 Grafana 和 Prometheus 后,您需要配置 Ceph Dashboard 将用于访问 Grafana 的连接信息。
您需要告诉 Dashboard Grafana 实例正在运行的/部署的 URL:
ceph dashboard set-grafana-api-url <grafana-server-url> # default: ''
URL 的格式为:<协议>:<IP 地址>:<端口>
注意
Ceph Dashboard 通过iframeHTML 元素嵌入 Grafana Dashboard。如果 Grafana 配置没有 SSL/TLS 支持,大多数浏览器将阻止嵌入不安全内容,如果 Dashboard 启用了 SSL 支持(默认情况下是如此)。如果您在启用上述功能后看不到嵌入的 Grafana Dashboard,请检查您的浏览器文档,了解如何取消阻止混合内容。或者,请考虑在 Grafana 中启用 SSL/TLS 支持。
如果您使用的是 Grafana 的自签名证书,请在 Dashboard 中禁用证书验证,以避免拒绝连接,这可能是由未知 CA 签署的证书或与主机名不匹配的证书引起的:
ceph dashboard set-grafana-api-ssl-verify False
您也可以直接访问 Grafana 来监控您的集群。
注意
Ceph Dashboard 配置信息也可以被取消设置。例如,要清除上面配置的 Grafana API URL:
ceph dashboard reset-grafana-api-url
浏览器替代 URL
Ceph Dashboard 后端需要 Grafana URL 才能在前端加载它们之前验证 Grafana Dashboard 的存在。由于 Grafana 在 Ceph Dashboard 中的实现方式,这意味着需要两个工作连接才能在 Ceph Dashboard 中看到 Grafana 图表:
后端(Ceph Mgr 模块)需要验证请求图表的存在。如果此请求成功,它会让前端知道它可以安全地访问 Grafana。
前端然后使用 iframe 直接从用户的浏览器请求 Grafana 图表。直接访问 Grafana 实例,没有任何通过 Ceph Dashboard 的中转。
现在,可能的情况是您的环境使得用户的浏览器难以直接访问 Ceph Dashboard 中配置的 URL。为了解决这个问题,可以配置一个单独的 URL,它将仅用于告诉前端(用户的浏览器)它应该使用哪个 URL 来访问 Grafana。此设置永远不会自动更改,与Cephadm设置的 GRAFANA_API_URL 不同(仅当使用 cephadm 部署监控服务时才会设置)。
要更改返回给前端的有效 URL,请发出以下命令:
ceph dashboard set-grafana-frontend-api-url <grafana-server-url>
如果未为此选项设置值,它将简单地回退到
启用单点登录 (SSO)
Ceph Dashboard 支持通过SAML 2.0协议对外部身份提供者进行用户身份验证。您需要首先创建用户账户并将它们与所需的角色相关联,因为授权由 Dashboard 执行。但是,身份验证过程可以由现有的身份提供者 (IdP) 执行。
注意
Ceph Dashboard SSO 支持依赖于 onelogin 的python-saml库。请确保此库已安装在您的系统上,可以使用您的发行版的包管理器或通过 Python 的pip安装程序。
要在 Ceph Dashboard 中配置 SSO,您应该使用以下命令:
ceph dashboard sso setup saml2 <ceph_dashboard_base_url> <idp_metadata> {<idp_username_attribute>} {<idp_entity_id>} {<sp_x_509_cert>} {<sp_private_key>}
参数:
<ceph_dashboard_base_url>: Ceph Dashboard 可访问的基 URL(例如,https://cephdashboard.local)
<idp_metadata>: IdP 元数据 XML 的 URL 到远程 (http://, https://) 或本地 (file://) 路径或内容(例如,https://myidp/metadata, file:///home/myuser/metadata.xml).
<idp_username_attribute> (可选): 用于从身份验证响应中获取用户名的属性。默认值为uid.
<idp_entity_id> (可选): 当 IdP 元数据中存在多个实体 ID 时使用此参数。
<sp_x_509_cert> / <sp_private_key> (可选): Ceph Dashboard(服务提供者)应使用的证书文件路径(这些文件路径应可由活动的 ceph-mgr 实例访问)。
注意
SAML 请求的发布者值将遵循此模式:<ceph_dashboard_base_url>/auth/saml2/metadata
要显示当前的 SAML 2.0 配置,请使用以下命令:
ceph dashboard sso show saml2
注意
更多关于onelogin_settings的信息,请查看onelogin 文档.
要禁用 SSO:
ceph dashboard sso disable
要检查 SSO 是否启用:
ceph dashboard sso status
要启用 SSO:
ceph dashboard sso enable saml2
启用 Prometheus 警报
要使用 Prometheus 进行告警,您必须定义告警规则这些由Alertmanager管理。安装它,因为它接收并管理来自 Prometheus 的告警。
Alertmanager 功能可以通过三种不同的方式被 Dashboard 消费:
使用 Dashboard 的通知接收器。
使用 Prometheus Alertmanager API。
同时使用这两种来源。
这三种方法都会通知您有关告警的信息。如果您同时使用这两种来源,您不会收到两次通知,但您至少需要消费 Alertmanager API 才能管理静默。
使用 Dashboard 的通知接收器
这允许您从 Alertmanager 获取通知,例如配置。一旦发送通知,您就会在 Dashboard 中收到通知,但您无法管理告警。
在 Alertmanager 配置中添加 Dashboard 接收器和新路由。这应该看起来像这样:
route:
  receiver: 'ceph-dashboard'
...
receivers:
  - name: 'ceph-dashboard'
    webhook_configs:
    - url: '<url-to-dashboard>/api/prometheus_receiver'
确保 Alertmanager 将您的 SSL 证书视为 Dashboard 有效。有关正确配置的更多信息,请查看<http_config> 文档.
使用 Prometheus 和 Alertmanager 的 API
这允许您管理告警和静默,并将启用“活动告警”、“所有告警”以及“静默”选项卡,位于“集群”菜单条目的“监控”部分。
告警可以按名称、作业、严重性、状态和开始时间排序。不幸的是,无法根据您的配置通过 Alertmanager 的通知来知道告警何时被发送出去,因此 Dashboard 将在告警的任何可见更改时通知用户,并将更改后的告警通知用户。
静默可以按 ID、创建者、状态、开始、更新和结束时间排序。静默可以以多种方式创建,也可以过期。9127be: 从头开始创建
Create from scratch
基于选定的告警
重新创建过期的静默
更新静默(这将重新创建并过期(默认 Alertmanager 行为))
要使用它,请指定 Alertmanager 服务器的主机名和端口:
ceph dashboard set-alertmanager-api-host <alertmanager-host:port> # default: ''例如:
ceph dashboard set-alertmanager-api-host 'http://localhost:9093'要查看所有配置的告警,您需要配置到 Prometheus API 的 URL。使用此 API,UI 还将帮助您验证新静默是否与相应的告警匹配。
ceph dashboard set-prometheus-api-host <prometheus-host:port> # default: ''例如:
ceph dashboard set-prometheus-api-host 'http://localhost:9090'设置好主机后,请刷新您的浏览器 Dashboard 窗口或选项卡。
同时使用这两种方法
这两种方法的配置方式是它们不应该相互干扰,通过烦人的重复通知可能会出现。
如果您使用 Prometheus 或 Alertmanager 设置中的自签名证书,您应该在 Dashboard 中禁用证书验证,以避免拒绝连接,这可能是由未知 CA 签署的证书或与主机名不匹配的证书引起的。
对于 Prometheus:
ceph dashboard set-prometheus-api-ssl-verify False
对于 Alertmanager:
ceph dashboard set-alertmanager-api-ssl-verify False
用户和角色管理
密码策略
默认情况下密码策略功能是启用的,它包括以下检查:
密码是否比 N 个字符长?
旧密码和新密码是否相同?
密码策略功能可以完全开启或关闭:
ceph dashboard set-pwd-policy-enabled <true|false>
以下单独的检查也可以开启或关闭:
ceph dashboard set-pwd-policy-check-length-enabled <true|false>
ceph dashboard set-pwd-policy-check-oldpwd-enabled <true|false>
ceph dashboard set-pwd-policy-check-username-enabled <true|false>
ceph dashboard set-pwd-policy-check-exclusion-list-enabled <true|false>
ceph dashboard set-pwd-policy-check-complexity-enabled <true|false>
ceph dashboard set-pwd-policy-check-sequential-chars-enabled <true|false>
ceph dashboard set-pwd-policy-check-repetitive-chars-enabled <true|false>
此外,以下选项可用于配置密码策略。
最小密码长度(默认为 8):
ceph dashboard set-pwd-policy-min-length <N>
最小密码复杂度(默认为 10):
ceph dashboard set-pwd-policy-min-complexity <N>密码复杂度是通过将密码中的每个字符分类来计算的。复杂度计数从 0 开始。根据以下规则对密码中的每个字符进行评级,按给定顺序。
如果字符是数字,则增加 1。
如果字符是 ASCII 小写字符,则增加 1。
如果字符是 ASCII 大写字符,则增加 2。
如果字符是特殊字符,则增加 3。
!"#$%&'()*+,-./:;<=>?@[\]^_`{|}~.如果字符没有通过前面的规则分类,则增加 5。
一个逗号分隔的单词列表,不允许在密码中使用:
ceph dashboard set-pwd-policy-exclusion-list <word>[,...]
用户账户
Ceph Dashboard 支持多个用户账户。每个用户账户由用户名、密码(使用bcrypt加密形式存储)组成,可选名称和可选电子邮件地址。
如果通过 Web UI 创建新用户,则可以设置一个选项,要求用户在首次登录时必须分配新密码。
用户账户存储在监视器的配置数据库中,并且对所有ceph-mgr实例都可用。
我们提供了一套用于管理用户账户的 CLI 命令:
显示用户(s):
ceph dashboard ac-user-show [<username>]创建用户:
ceph dashboard ac-user-create [--enabled] [--force-password] [--pwd_update_required] <username> -i <file-containing-password> [<rolename>] [<name>] [<email>] [<pwd_expiration_date>]要绕过密码策略检查,请使用force-password选项。pwd_update_required这样,新创建的用户在首次登录后必须更改密码。
删除用户:
ceph dashboard ac-user-delete <username>更改密码:
ceph dashboard ac-user-set-password [--force-password] <username> -i <file-containing-password>更改密码哈希:
ceph dashboard ac-user-set-password-hash <username> -i <file-containing-password-hash>哈希必须是 bcrypt 哈希和盐,例如
$2b$12$Pt3Vq/rDt2y9glTPSV.VFegiLkQeIpddtkhoFetNApYmIJOY8gau2。这可以用于从外部数据库导入用户。修改用户(名称和电子邮件):
ceph dashboard ac-user-set-info <username> <name> <email>禁用用户:
ceph dashboard ac-user-disable <username>启用用户:
ceph dashboard ac-user-enable <username>
用户角色和权限
用户账户与一组角色相关联,这些角色定义了可以访问 Dashboard 功能。
Dashboard 功能/模块按security scope安全范围
hosts: 包括与
Hosts菜单条目相关的所有功能。config-opt: 包括与 Ceph 配置选项管理相关的所有功能。
pool: 包括与池管理相关的所有功能。
osd: 包括与 OSD 管理相关的所有功能。
monitor: 包括与监视器管理相关的所有功能。
rbd-image: 包括与 RBD 图像管理相关的所有功能。
rbd-mirroring: 包括与 RBD 镜像管理相关的所有功能。
iscsi: 包括与 iSCSI 管理相关的所有功能。
rgw: 包括与 RADOS Gateway (RGW) 管理相关的所有功能。
cephfs: 包括与 CephFS 管理相关的所有功能。
nfs-ganesha: 包括与 NFS Ganesha 管理相关的所有功能。
manager: 包括与 Ceph 管理器管理相关的所有功能。
log: 包括与 Ceph 日志管理相关的所有功能。
grafana: 包括与 Grafana 代理相关的所有功能。
prometheus: 包括与 Prometheus 告警管理相关的所有功能。
dashboard-settings: 允许更改 Dashboard 设置。
A role指定一组在security scope与一组权限之间的映射。权限有四种类型:
读取
创建
更新
删除
以下是一个角色规范的示例,以 Python 字典的形式:
# example of a role
{
  'role': 'my_new_role',
  'description': 'My new role',
  'scopes_permissions': {
    'pool': ['read', 'create'],
    'rbd-image': ['read', 'create', 'update', 'delete']
  }
}
该角色规定用户具有读取和创建权限,用于与池管理相关的功能,并且具有与 RBD 图像管理相关的功能的完全权限。
Dashboard 提供了一组预定义的角色,我们称之为系统角色,这些角色可以立即由全新的 Ceph Dashboard 安装使用。
系统角色的列表是:
administrator: 允许对所有安全范围具有完全权限。
read-only: 允许读取权限,除 Dashboard 设置之外的所有安全范围。
block-manager: 允许对rbd-image, rbd-mirroring, andiscsi范围具有完全权限。
rgw-manager: 允许对rgw范围具有完全权限。
cluster-manager: 允许对hosts, osd, monitor, manager, andconfig-opt范围具有完全权限。
pool-manager: 允许对pool范围具有完全权限。
cephfs-manager: 允许对cephfs范围具有完全权限。
可用角色的列表可以使用以下命令检索:
ceph dashboard ac-role-show [<rolename>]
您也可以使用 CLI 创建新的角色。可用的命令如下:
创建角色:
ceph dashboard ac-role-create <rolename> [<description>]删除角色:
ceph dashboard ac-role-delete <rolename>向角色添加范围权限:
ceph dashboard ac-role-add-scope-perms <rolename> <scopename> <permission> [<permission>...]从角色删除范围权限:
ceph dashboard ac-role-del-scope-perms <rolename> <scopename>
要将角色分配给用户,以下命令可用:
设置用户角色:
ceph dashboard ac-user-set-roles <username> <rolename> [<rolename>...]向用户添加角色:
ceph dashboard ac-user-add-roles <username> <rolename> [<rolename>...]从用户删除角色:
ceph dashboard ac-user-del-roles <username> <rolename> [<rolename>...]
用户和自定义角色创建示例
在本节中,我们展示了创建用户账户的完整命令,该账户可以管理 RBD 图像、查看和创建 Ceph 池,并对其他范围具有只读访问权限。
创建用户:
ceph dashboard ac-user-create bob -i <file-containing-password>创建角色并指定范围权限:
ceph dashboard ac-role-create rbd/pool-manager
ceph dashboard ac-role-add-scope-perms rbd/pool-manager rbd-image read create update delete
ceph dashboard ac-role-add-scope-perms rbd/pool-manager pool read create
将角色关联到用户:
ceph dashboard ac-user-set-roles bob rbd/pool-manager read-only
代理配置
在一个 Ceph 集群中,有多个ceph-mgr实例,只有当前活动的ceph-mgrdaemon 将运行在 dashboard 上提供传入请求。连接到备用ceph-mgr实例的 dashboard 的 TCP 端口将接收一个 HTTP 重定向(303)到活动管理器的 dashboard URL。这使您能够将您的浏览器指向集群中的任何ceph-mgr实例以访问 dashboard。
如果您想要建立一个固定的 URL 来访问 dashboard 或如果您不想允许直接连接到管理节点,您可以在代理上设置一个代理,它将自动将传入请求转发到活动的ceph-mgr实例。
配置 URL 前缀
如果您通过反向代理访问 dashboard,您可能希望服务它 under a URL 前缀。要使 dashboard 使用包含您的前缀的超链接,您可以设置url_prefix设置:
ceph config set mgr mgr/dashboard/url_prefix $PREFIX
so you can access the dashboard athttp://$IP:$PORT/$PREFIX/.
禁用重定向
如果 dashboard 是在像HAProxy这样的负载均衡代理后面,您可能想要禁用重定向以防止情况发生,其中内部(无法解决)URL 发布到前端客户端。使用以下命令来使 dashboard 响应 HTTP 错误(默认为 500)
ceph config set mgr mgr/dashboard/standby_behaviour "error"
要重置设置以默认重定向,请使用以下命令:
ceph config set mgr mgr/dashboard/standby_behaviour "redirect"
配置错误状态代码
当重定向被禁用时,您可能想要自定义备用 dashboard 的 HTTP 状态代码。为此,您需要运行命令:
ceph config set mgr mgr/dashboard/standby_error_status_code 503
重定向之前将 IP 地址解析为主机名
从备用 dashboard 重定向到活动 dashboard 是通过管理器的 IP 地址,而不是管理器的主机名进行的。在虚拟化环境中,基于 IP 地址的重定向比基于主机名解析减少错误。由于基于主机名解析增加了错误的风险,因此默认情况下禁用了主机名解析选项。
然而,在某些情况下,通过主机名重定向可能会有所帮助。例如,如果配置的 TLS 证书仅匹配主机名,而不匹配这些主机名的 IP 地址,则主机名重定向将更可取。
要激活通过管理器主机名从备用 dashboard 到活动 dashboard 的重定向,请运行以下命令:
ceph config set mgr mgr/dashboard/redirect_resolve_ip_addr True
通过运行以下命令禁用主机名重定向:
ceph config set mgr mgr/dashboard/redirect_resolve_ip_addr False
警告
如果您尝试使用上述命令激活重定向,并且您收到错误消息EINVAL: unrecognized config option
'mgr/dashboard/redirect_resolve_ip_addr',那么您可能正在运行 Ceph 的一个版本,该版本早于 17.2.6 版本。此功能是在 17.2.6 中引入的,在提交中:https://github.com/ceph/ceph/pull/48219.
HAProxy 示例配置
以下是一个使用HAProxy.
进行 SSL/TLS 透传的示例配置。请注意,此配置在以下条件下工作。如果 dashboard 失败切换,前端客户端可能会收到一个 HTTP 重定向(303)响应,并且将被重定向到一个无法解决的 host。这发生在两个 HAProxy 健康检查之间发生故障切换时。在这种情况下,先前活动的 dashboard 节点现在将响应 303,指向新的活动节点。为了防止这种情况,您应该考虑在备用节点上禁用重定向。
defaults
  log global
  option log-health-checks
  timeout connect 5s
  timeout client 50s
  timeout server 450s

frontend dashboard_front
  mode http
  bind *:80
  option httplog
  redirect scheme https code 301 if !{ ssl_fc }

frontend dashboard_front_ssl
  mode tcp
  bind *:443
  option tcplog
  default_backend dashboard_back_ssl

backend dashboard_back_ssl
  mode tcp
  option httpchk GET /
  http-check expect status 200
  server x <HOST>:<PORT> check check-ssl verify none
  server y <HOST>:<PORT> check check-ssl verify none
  server z <HOST>:<PORT> check check-ssl verify none
审计 API 请求
REST API 可以将 PUT、POST 和 DELETE 请求记录到 Ceph
ceph dashboard set-audit-api-enabled <true|false>
如果启用,则每个请求都会记录以下参数:
from - 请求的来源,例如https://[::1]:44410
path - REST API 路径,例如 /api/auth
method - e.g. PUT、POST 或 DELETE
user - 用户名称,否则 ‘None’
请求负载的记录(参数及其值)默认启用。执行以下命令以禁用此行为:
ceph dashboard set-audit-api-log-payload <true|false>
一个日志条目可能如下所示:
2018-10-22 15:27:01.302514 mgr.x [INF] [DASHBOARD] from='https://[::ffff:127.0.0.1]:37022' path='/api/rgw/user/klaus' method='PUT' user='admin' params='{"max_buckets": "1000", "display_name": "Klaus Mustermann", "uid": "klaus", "suspended": "0", "email": "klaus.mustermann@ceph.com"}'
NFS-Ganesha 管理
dashboard 要求启用 NFS 模块,该模块将用于管理 NFS 集群和 NFS 导出。更多信息请参阅CephFS 和 RGW 导出 over NFS.
插件
插件以模块化和松散耦合的方式扩展了 Ceph Dashboard 的功能。
功能开关
此插件允许按需启用或禁用 Ceph Dashboard 的一些功能。当功能被禁用时:
其前端元素(网页、菜单条目、图表等)将变得隐藏。
其关联的 REST API 端点将拒绝任何进一步的请求(404,未找到错误)。
此插件的主要目的是允许对 dashboard 暴露的工作流进行 ad-hoc 定制。此外,它还可以允许动态启用实验性功能,而无需配置负担和服务影响。
可以启用/禁用的功能列表是:
- Block (RBD):
图像管理:
rbd镜像:
mirroringiSCSI:
iscsi
文件系统 (Cephfs):
cephfs对象 (RGW):
rgw(包括守护进程、用户和桶管理)。NFS:
nfs-ganesha导出。
默认情况下所有功能都是启用的。
要检索功能列表及其当前状态:
ceph dashboard feature status
Feature 'cephfs': 'enabled'
Feature 'iscsi': 'enabled'
Feature 'mirroring': 'enabled'
Feature 'rbd': 'enabled'
Feature 'rgw': 'enabled'
Feature 'nfs': 'enabled'
要启用或禁用单个或多个功能的状态:
ceph dashboard feature disable iscsi mirroring
Feature 'iscsi': disabled
Feature 'mirroring': disabled
在功能状态更改后,API REST 端点会立即响应该更改,但它可能需要长达二十(20)秒才能使前端 UI 元素反映更改。
调试
此插件允许根据调试模式自定义 dashboard 的行为。它可以被启用、禁用或检查,如下所示:
ceph dashboard debug status
Debug: 'disabled'
ceph dashboard debug enable
Debug: 'enabled'
ceph dashboard debug disable
Debug: 'disabled'
默认情况下,它被禁用。这是生产部署的推荐设置。如果需要,可以在不需要重新启动的情况下启用调试模式。production环境,而启用时,它使用test_suite默认值(请参阅CherryPy 环境以获取更多详细信息)。 for more
details).
它还向不支持此功能的 CherryPy 版本添加请求 uuid (unique_id)。它还打印unique_id到错误响应和日志消息。
每日信息 (MOTD)
在 Ceph Dashboard 的顶部显示配置的消息at the top of the Ceph Dashboard.
消息的重要性可以通过其严重性来配置,其严重性是警告严重性的消息将在新会话中再次显示。, 警告或危险。消息可以在给定时间后过期,这意味着它将不再在 UI 中显示。使用以下语法指定过期时间:Ns|m|h|d|w对于秒、分钟、小时、天和周。如果消息应在 2 小时后过期,请使用2h或5w对于 5 周。使用0来配置一个不会过期的消息。
要配置消息,请运行以下命令:
ceph dashboard motd set <severity:info|warning|danger> <expires> <message>
要显示配置的消息:
ceph dashboard motd get
要清除配置的消息运行:
ceph dashboard motd clear
一个具有警告严重性的消息将在新会话中再次显示。或警告消息不再显示,直到本地存储 cookies 被清除或显示不同严重性的新消息。一个具有警告严重性的消息将在新会话中再次显示。 MOTD is not displayed anymore until the local storage cookies are cleared or a new MOTD with a different severity is displayed. A MOTD with a ‘warning’ severity will be displayed again in a new session.
解决 Dashboard 问题
定位 Dashboard
如果您不确定 Ceph Dashboard 的位置,请运行以下命令:
ceph mgr services | jq .dashboard
"https://host:port"
该命令返回 Ceph Dashboard 的位置 URL:https://<host>:<port>/
注意
许多 Ceph 工具返回 JSON 格式的结果。我们建议您安装jq命令行工具以方便处理 JSON 数据。
访问 Dashboard
如果您无法访问 Ceph Dashboard,请运行以下
验证 Ceph Dashboard 模块是否启用:
ceph mgr module ls | jq .enabled_modules确保返回值中包含 Ceph Dashboard 模块。示例 snipped output from the
[
  "dashboard",
  "iostat",
  "restful"
]
如果它没有列出,请使用以下命令激活模块:
ceph mgr module enable dashboard检查 Ceph Dashboard 和/或
ceph-mgr日志文件以查找任何错误。检查
ceph-mgr日志消息被写入文件:ceph config get mgr log_to_filetrue获取日志文件的位置(默认为
/var/log/ceph/<cluster-name>-<daemon-name>.log):ceph config get mgr log_file/var/log/ceph/$cluster-$name.log
确保 SSL/TLS 支持配置正确:
检查是否启用 SSL/TLS 支持:
ceph config get mgr mgr/dashboard/ssl如果命令返回
true,请验证证书是否存在:ceph config-key get mgr/dashboard/crtand:
ceph config-key get mgr/dashboard/key如果它不返回
true,请运行以下命令以生成自签名证书或遵循SSL/TLS 支持说明:ceph dashboard create-self-signed-cert
登录 Dashboard 出现问题
如果您无法登录到 Ceph Dashboard 并您收到以下错误,请执行以下程序检查:

检查您的用户凭证是否正确。如果您在尝试登录 Ceph Dashboard 时看到上述通知消息,则很可能是您使用了错误的凭证。请双检查您的用户名和密码,并确保您的键盘的 caps lock 按钮没有被意外启用。
如果您的用户凭证正确,但您仍然遇到相同的错误,请检查用户账户是否存在:
ceph dashboard ac-user-show <username>这个命令返回您的用户数据。如果用户不存在,它将打印:
Error ENOENT: User <username> does not exist
检查用户是否启用:
ceph dashboard ac-user-show <username> | jq .enabledtrue检查
enabled是否被设置为true为您的用户。如果不是,用户未启用,请运行:ceph dashboard ac-user-enable <username>
请参阅用户和角色管理以获取更多信息。
仪表板功能无法正常工作
当后端发生错误时,您通常会在前端收到错误通知。通过以下场景进行调试。
检查 Ceph 仪表板和
ceph-mgr日志文件以查找任何错误。这些可以通过搜索关键字找到,例如500 内部服务器错误,后跟traceback。跟踪错误的末尾包含有关确切错误发生的更多详细信息。检查您的网络浏览器的 JavaScript 控制台是否有任何错误。
Ceph 仪表板日志
仪表板调试标志
启用此标志后,错误跟踪将包含在后台响应中。
通过 Ceph 仪表板启用此标志,导航到集群到管理器模块。选择仪表板模块并点击编辑按钮。点击调试复选框并更新。
通过 CLI 启用此标志,运行以下命令:
ceph dashboard debug enable
设置仪表板模块的日志级别
将日志级别设置为调试会使日志更详细,有助于调试。
增加管理器守护程序的日志级别:
ceph tell mgr config set debug_mgr 20通过仪表板或 CLI 调整 Ceph 仪表板模块的日志级别:
导航到集群到管理器模块。选择仪表板模块并点击编辑按钮。修改
log_level配置。通过 CLI 调整它,运行以下命令:
bin/ceph config set mgr mgr/dashboard/log_level debug
3. 高日志级别会导致大量日志,这可能会很快填满您的文件系统。设置一个日历提醒,在未来的一小时、一天或一周内恢复此临时日志增加。这看起来像这样:
ceph config log... --- 11 --- 2020-11-07 11:11:11.960659 --- mgr.x/dashboard/log_level = debug --- ...ceph config reset 11
在仪表板中启用集中式日志记录
要了解更多关于集中式日志记录的信息,请查看Ceph 中的集中式日志记录
在任何特定主机上创建 Loki 服务,使用“创建服务”选项。70f553: 同样创建 Promtail 服务,它将默认部署在所有运行的主机上。
Similarly create the Promtail service which will be by default deployed
要查看调试级消息以及 info 级事件,请通过 CLI 运行以下命令:
ceph config set mgr mgr/cephadm/log_to_cluster_level debug要启用文件日志记录,请通过 CLI 运行以下命令:
ceph config set global log_to_file true
ceph config set global mon_cluster_log_to_file true
点击集群 -> 日志下的 Daemon Logs 选项卡。
您可以在点击 Log 浏览器按钮时找到一些预定义的标签,例如文件名、作业等,这些标签可以帮助您一次性查询日志。
您可以使用 LogQL 进行高级搜索并执行一些计算,以及 -https://grafana.com/docs/loki/latest/logql/.
从仪表板报告问题
Ceph-Dashboard 提供了两种创建 Ceph 问题跟踪器中问题的方法,使用 Ceph 命令行界面或使用 Ceph Dashboard 用户界面。
要在 Ceph 问题跟踪器中创建问题,用户需要在问题跟踪器上有一个账户。在 Ceph 问题跟踪器中的my account标签页,用户可以看到他们的 API 访问密钥。此密钥用于创建新问题时进行身份验证。要将 Ceph API 访问密钥存储在 CLI 中,请运行:
``ceph dashboard set-issue-tracker-api-key -i <file-containing-key>``
然后,在成功更新后,您可以使用以下命令创建问题:
``ceph dashboard create issue <project> <tracker_type> <subject> <description>``
可创建问题的可用项目是:
可用跟踪器类型是:
主题和描述由用户设置。
用户也可以使用仪表板用户界面创建问题。导航栏右上角的设置图标下拉菜单中有Raise an issue选项。点击它,将打开一个模态对话框,其中可以选择项目和跟踪器从各自的下拉菜单。主题和多行描述由用户添加。然后用户可以提交问题。
由 Ceph 基金会带给您
Ceph 文档是一个社区资源,由非盈利的 Ceph 基金会资助和托管Ceph Foundation。如果您想支持这一点和我们的其他工作,请考虑加入现在加入.