
绘图
本页面介绍如何绘制价格、指标和收益。
已弃用
本页面中描述的命令(plot-dataframe、plot-profit)已被视为弃用,仅处于维护状态。这主要是因为即使是中等规模的图表也可能导致性能问题,同时也因为“存储文件并在浏览器中打开”的方式在用户界面体验上不够直观。
尽管目前没有立即移除这些功能的计划,但它们不再积极维护——如果需要重大修改才能使其正常运行,则可能会在短期内被移除。
请使用 FreqUI 来满足绘图需求,它不会遇到相同的性能问题。
安装 / 设置
绘图模块使用 Plotly 库。您可以通过运行以下命令来安装或升级该库:
pip install -U -r requirements-plot.txt
绘制价格和指标
freqtrade plot-dataframe 子命令会显示一个包含三个子图的交互式图表:
- 主图:包含蜡烛图以及随价格变化的指标(如 SMA/EMA)
- 成交量柱状图
- 由
--indicators2参数指定的额外指标
可用参数:
usage: freqtrade plot-dataframe [-h] [-v] [--no-color] [--logfile FILE] [-V]
                                [-c PATH] [-d PATH] [--userdir PATH] [-s NAME]
                                [--strategy-path PATH]
                                [--recursive-strategy-search]
                                [--freqaimodel NAME] [--freqaimodel-path PATH]
                                [-p PAIRS [PAIRS ...]]
                                [--indicators1 INDICATORS1 [INDICATORS1 ...]]
                                [--indicators2 INDICATORS2 [INDICATORS2 ...]]
                                [--plot-limit INT] [--db-url PATH]
                                [--trade-source {DB,file}]
                                [--export {none,trades,signals}]
                                [--backtest-filename PATH]
                                [--timerange TIMERANGE] [-i TIMEFRAME]
                                [--no-trades]

options:
  -h, --help            show this help message and exit
  -p, --pairs PAIRS [PAIRS ...]
                        Limit command to these pairs. Pairs are space-
                        separated.
  --indicators1 INDICATORS1 [INDICATORS1 ...]
                        Set indicators from your strategy you want in the
                        first row of the graph. Space-separated list. Example:
                        `ema3 ema5`. Default: `['sma', 'ema3', 'ema5']`.
  --indicators2 INDICATORS2 [INDICATORS2 ...]
                        Set indicators from your strategy you want in the
                        third row of the graph. Space-separated list. Example:
                        `fastd fastk`. Default: `['macd', 'macdsignal']`.
  --plot-limit INT      Specify tick limit for plotting. Notice: too high
                        values cause huge files. Default: 750.
  --db-url PATH         Override trades database URL, this is useful in custom
                        deployments (default: `sqlite:///tradesv3.sqlite` for
                        Live Run mode, `sqlite:///tradesv3.dryrun.sqlite` for
                        Dry Run).
  --trade-source {DB,file}
                        Specify the source for trades (Can be DB or file
                        (backtest file)) Default: file
  --export {none,trades,signals}
                        Export backtest results (default: trades).
  --backtest-filename, --export-filename PATH
                        Use this filename for backtest results.Example:
                        `--backtest-
                        filename=backtest_results_2020-09-27_16-20-48.json`.
                        Assumes either `user_data/backtest_results/` or
                        `--export-directory` as base directory.
  --timerange TIMERANGE
                        Specify what timerange of data to use.
  -i, --timeframe TIMEFRAME
                        Specify timeframe (`1m`, `5m`, `30m`, `1h`, `1d`).
  --no-trades           Skip using trades from backtesting file and DB.

Common arguments:
  -v, --verbose         Verbose mode (-vv for more, -vvv to get all messages).
  --no-color            Disable colorization of hyperopt results. May be
                        useful if you are redirecting output to a file.
  --logfile, --log-file FILE
                        Log to the file specified. Special values are:
                        'syslog', 'journald'. See the documentation for more
                        details.
  -V, --version         show program's version number and exit
  -c, --config PATH     Specify configuration file (default:
                        `userdir/config.json` or `config.json` whichever
                        exists). Multiple --config options may be used. Can be
                        set to `-` to read config from stdin.
  -d, --datadir, --data-dir PATH
                        Path to the base directory of the exchange with
                        historical backtesting data. To see futures data, use
                        trading-mode additionally.
  --userdir, --user-data-dir PATH
                        Path to userdata directory.

Strategy arguments:
  -s, --strategy NAME   Specify strategy class name which will be used by the
                        bot.
  --strategy-path PATH  Specify additional strategy lookup path.
  --recursive-strategy-search
                        Recursively search for a strategy in the strategies
                        folder.
  --freqaimodel NAME    Specify a custom freqaimodels.
  --freqaimodel-path PATH
                        Specify additional lookup path for freqaimodels.
示例:
freqtrade plot-dataframe -p BTC/ETH --strategy AwesomeStrategy
-p/--pairs 参数可用于指定要绘制的交易对。
注意
freqtrade plot-dataframe 子命令会为每个交易对生成一个独立的图表文件。
指定自定义指标。使用 --indicators1 指定主图中的指标,使用 --indicators2 指定下方子图中的指标(适用于与价格范围不同的指标)。
freqtrade plot-dataframe --strategy AwesomeStrategy -p BTC/ETH --indicators1 sma ema --indicators2 macd
更多使用示例
要绘制多个交易对,请用空格分隔它们:
freqtrade plot-dataframe --strategy AwesomeStrategy -p BTC/ETH XRP/ETH
要绘制特定时间段(用于放大查看):
freqtrade plot-dataframe --strategy AwesomeStrategy -p BTC/ETH --timerange=20180801-20180805
要绘制存储在数据库中的交易记录,请结合使用 --db-url 和 --trade-source DB:
freqtrade plot-dataframe --strategy AwesomeStrategy --db-url sqlite:///tradesv3.dry_run.sqlite -p BTC/ETH --trade-source DB
要绘制回测结果中的交易记录,请使用 --export-filename <filename>
freqtrade plot-dataframe --strategy AwesomeStrategy --export-filename user_data/backtest_results/backtest-result.json -p BTC/ETH
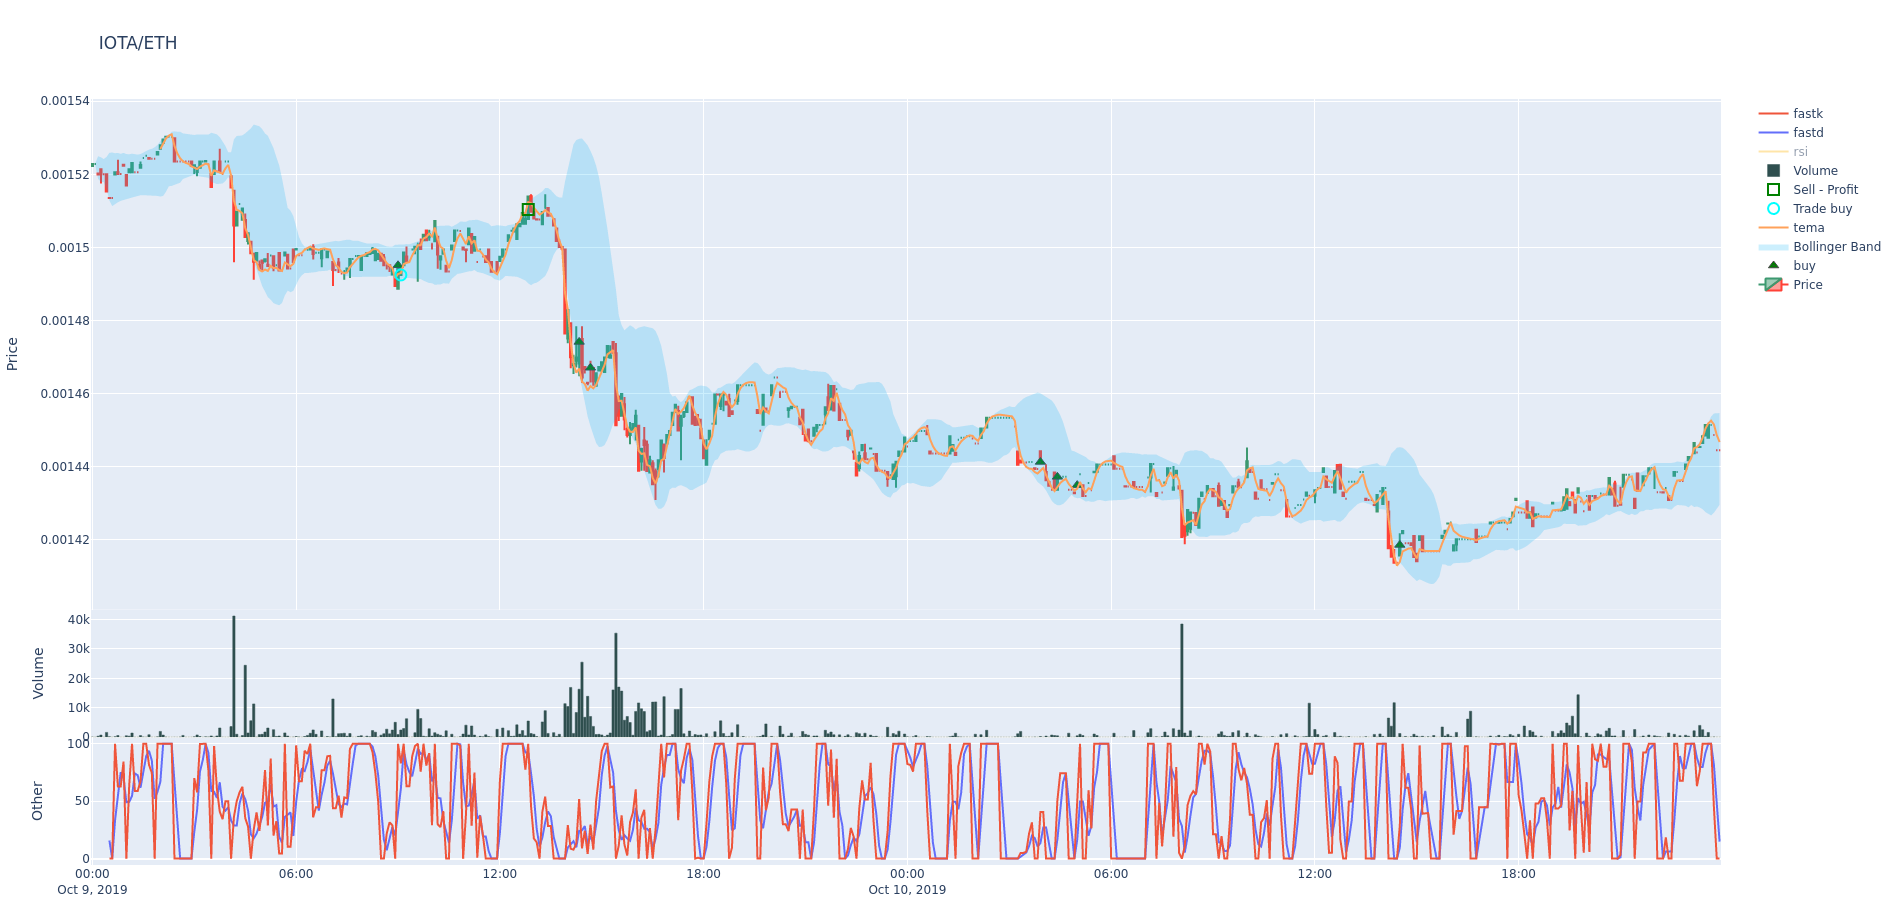
绘制数据框基础
plot-dataframe 子命令需要回测数据、一个策略,以及包含该策略对应交易记录的回测结果文件或数据库。
生成的图表将包含以下元素:
- 绿色三角形:策略产生的买入信号。(注意:并非每个买入信号都会生成交易,请与青色圆圈对比。)
- 红色三角形:策略产生的卖出信号。(同样,并非每个卖出信号都会结束一笔交易,请与红色和绿色方块对比。)
- 青色圆圈:交易的入场点。
- 红色方块:亏损或利润为 0%的交易的出场点。
- 绿色方块:盈利交易的出场点。
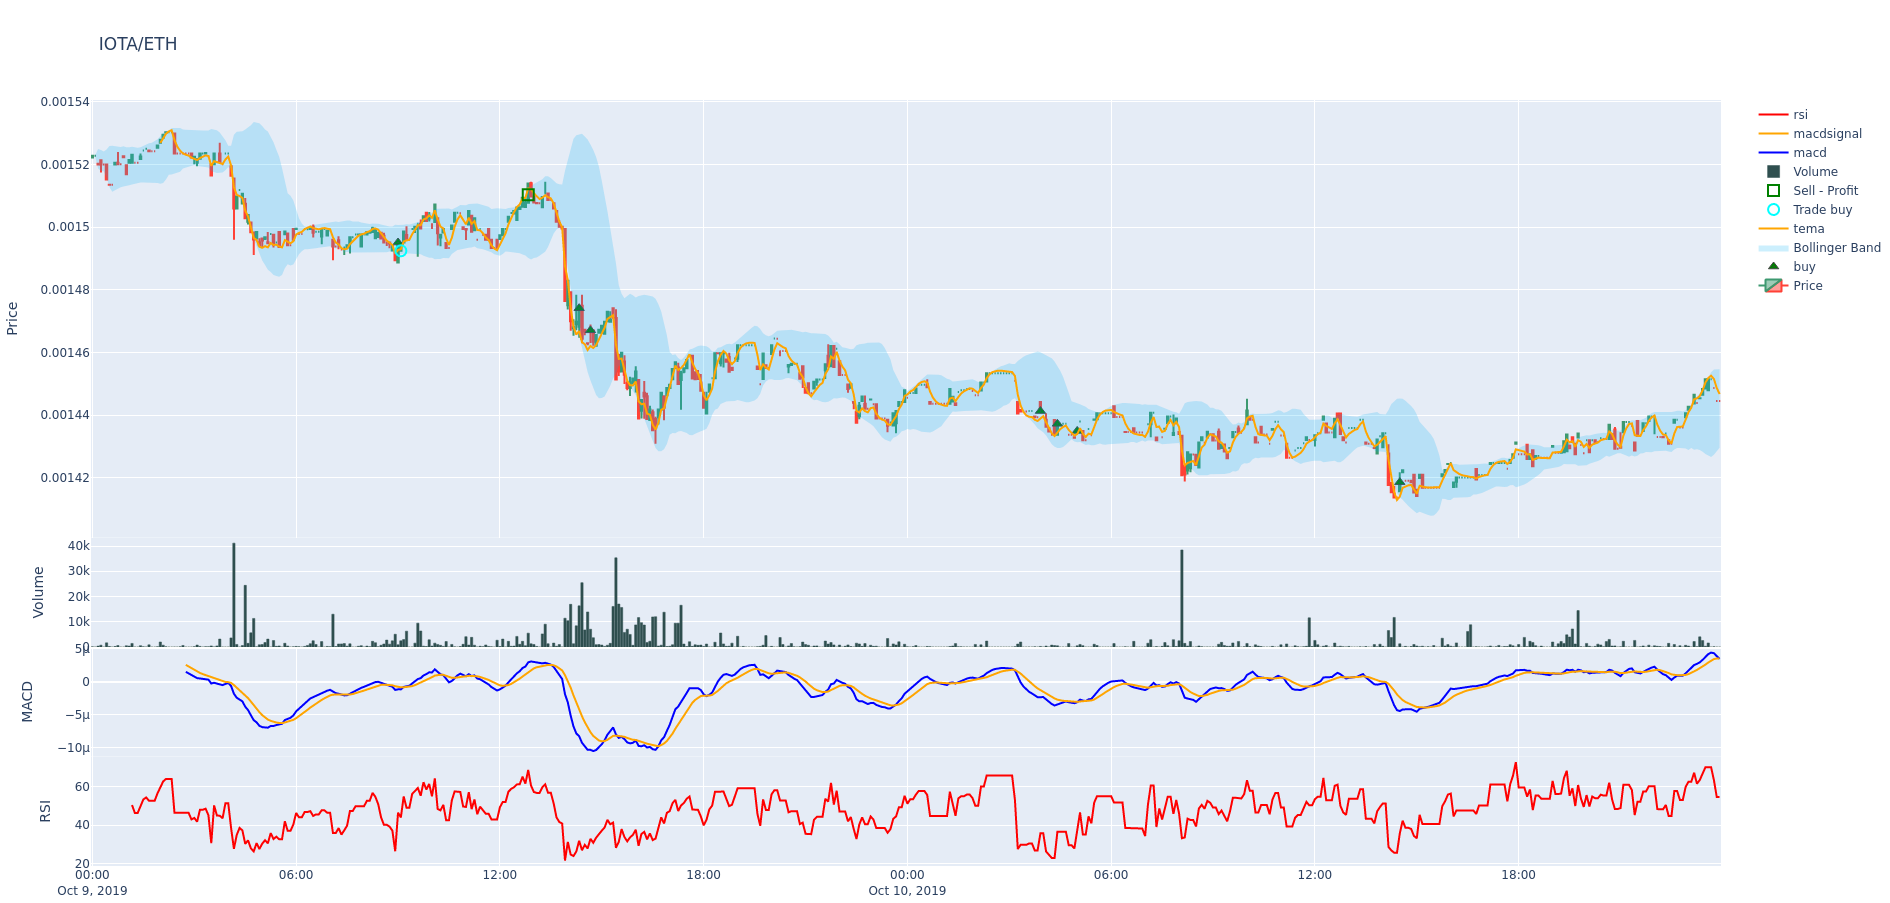
- 与 K 线图刻度对应的指标(例如 SMA/EMA),通过
--indicators1参数指定。 - 成交量(主图下方的柱状图)。
- 具有不同刻度值的指标(例如 MACD、RSI),显示在成交量柱下方,通过
--indicators2参数指定。
布林带
如果数据列中存在 bb_lowerband 和 bb_upperband,则布林带会自动添加到图表中,并以浅蓝色区域显示,从下轨延伸至上轨。
高级绘图配置
可以在策略的 plot_config 参数中指定高级绘图配置。
使用 plot_config 时的附加功能包括:
- 为每个指标指定颜色
- 指定额外的子图
- 指定指标对以填充它们之间的区域
下面的示例绘图配置为指标指定了固定颜色。否则,连续生成的图表每次可能使用不同的配色方案,导致难以比较。此外,它还允许多个子图同时显示 MACD 和 RSI。
可以使用 type 键配置绘图类型。可能的类型有:
scatter对应plotly.graph_objects.Scatter类(默认)。bar对应plotly.graph_objects.Bar类。
可在 plotly 字典中指定传递给 plotly.graph_objects.* 构造函数的额外参数。
带有内联注释的配置示例,解释其过程:
@property
def plot_config(self):
    """
        There are a lot of solutions how to build the return dictionary.
        The only important point is the return value.
        Example:
            plot_config = {'main_plot': {}, 'subplots': {}}

    """
    plot_config = {}
    plot_config['main_plot'] = {
        # Configuration for main plot indicators.
        # Assumes 2 parameters, emashort and emalong to be specified.
        f'ema_{self.emashort.value}': {'color': 'red'},
        f'ema_{self.emalong.value}': {'color': '#CCCCCC'},
        # By omitting color, a random color is selected.
        'sar': {},
        # fill area between senkou_a and senkou_b
        'senkou_a': {
            'color': 'green', #optional
            'fill_to': 'senkou_b',
            'fill_label': 'Ichimoku Cloud', #optional
            'fill_color': 'rgba(255,76,46,0.2)', #optional
        },
        # plot senkou_b, too. Not only the area to it.
        'senkou_b': {}
    }
    plot_config['subplots'] = {
         # Create subplot MACD
        "MACD": {
            'macd': {'color': 'blue', 'fill_to': 'macdhist'},
            'macdsignal': {'color': 'orange'},
            'macdhist': {'type': 'bar', 'plotly': {'opacity': 0.9}}
        },
        # Additional subplot RSI
        "RSI": {
            'rsi': {'color': 'red'}
        }
    }

    return plot_config
作为属性(旧方法)
也可以将 plot_config 赋值为属性(这是以前的默认方式)。这种方法的缺点是无法访问策略参数,导致某些配置无法生效。
    plot_config = {
        'main_plot': {
            # Configuration for main plot indicators.
            # Specifies `ema10` to be red, and `ema50` to be a shade of gray
            'ema10': {'color': 'red'},
            'ema50': {'color': '#CCCCCC'},
            # By omitting color, a random color is selected.
            'sar': {},
        # fill area between senkou_a and senkou_b
        'senkou_a': {
            'color': 'green', #optional
            'fill_to': 'senkou_b',
            'fill_label': 'Ichimoku Cloud', #optional
            'fill_color': 'rgba(255,76,46,0.2)', #optional
        },
        # plot senkou_b, too. Not only the area to it.
        'senkou_b': {}
        },
        'subplots': {
            # Create subplot MACD
            "MACD": {
                'macd': {'color': 'blue', 'fill_to': 'macdhist'},
                'macdsignal': {'color': 'orange'},
                'macdhist': {'type': 'bar', 'plotly': {'opacity': 0.9}}
            },
            # Additional subplot RSI
            "RSI": {
                'rsi': {'color': 'red'}
            }
        }
    }
注意
上述配置假定 ema10、ema50、senkou_a、senkou_b、macd、macdsignal、macdhist 和 rsi 是策略生成的 DataFrame 中的列。
警告
plotly 参数仅在使用 plotly 库时受支持,在 freq-ui 中无效。
交易持仓调整
如果使用了 position_adjustment_enable / adjust_trade_position(),交易的初始买入价格将基于多笔订单进行平均,因此交易的起始价格很可能出现在蜡烛图范围之外。
绘制收益
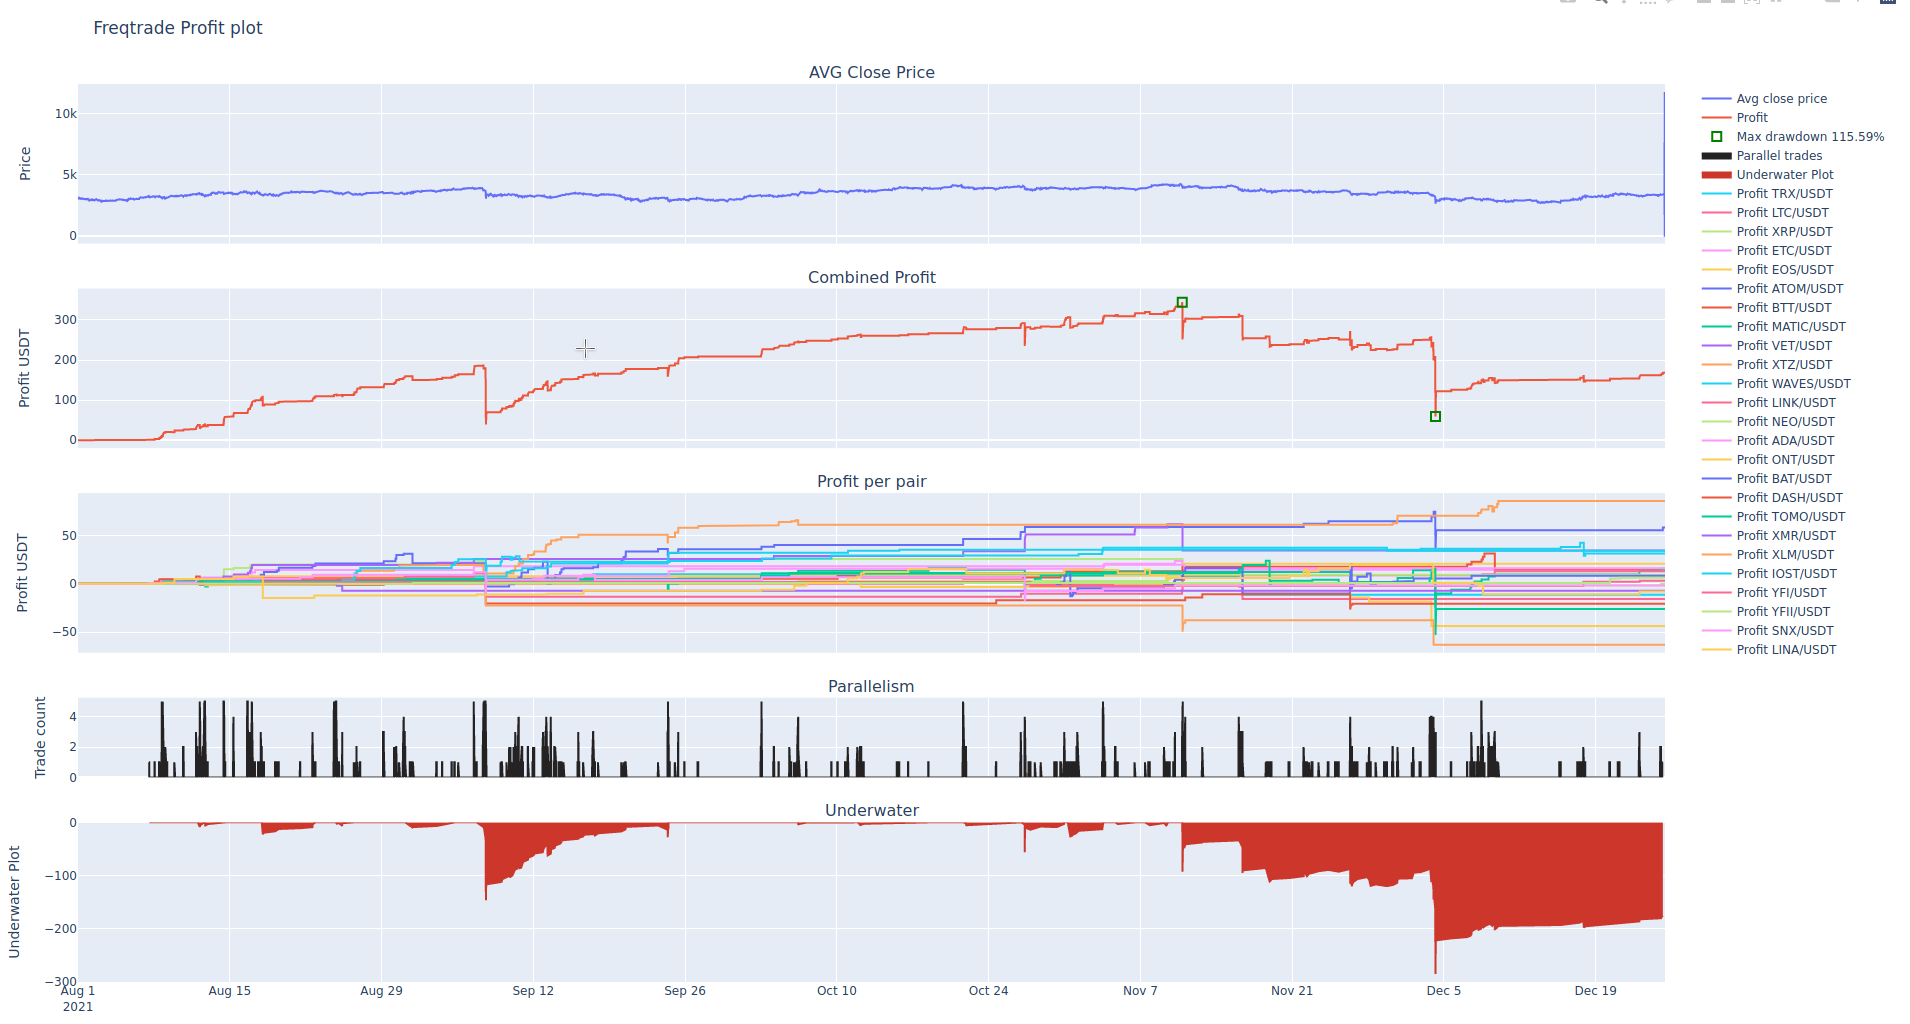
plot-profit 子命令会显示一个包含三个图表的交互式图形:
- 所有交易对的平均收盘价。
- 回测所产生的总收益。请注意,这并非真实世界的收益,而只是一个估算值。
- 每个单独交易对的收益。
- 交易的并行程度。
- 水下区域(回撤阶段)。
第一个图表有助于了解整体市场的走势情况。
第二个图表可用来判断你的算法是否有效。也许你希望算法能稳定地获取小幅利润,或者不频繁操作但产生大幅波动。该图表还会标出最大回撤期的开始(和结束)时间。
第三个图表有助于发现异常值,即某些交易对中导致收益激增的事件。
第四个图表可以帮助你分析交易的并行性,显示 max_open_trades 达到上限的频率。
freqtrade plot-profit 子命令的可用选项:
usage: freqtrade plot-profit [-h] [-v] [--no-color] [--logfile FILE] [-V]
                             [-c PATH] [-d PATH] [--userdir PATH] [-s NAME]
                             [--strategy-path PATH]
                             [--recursive-strategy-search]
                             [--freqaimodel NAME] [--freqaimodel-path PATH]
                             [-p PAIRS [PAIRS ...]] [--timerange TIMERANGE]
                             [--export {none,trades,signals}]
                             [--backtest-filename PATH] [--db-url PATH]
                             [--trade-source {DB,file}] [-i TIMEFRAME]
                             [--auto-open]

options:
  -h, --help            show this help message and exit
  -p, --pairs PAIRS [PAIRS ...]
                        Limit command to these pairs. Pairs are space-
                        separated.
  --timerange TIMERANGE
                        Specify what timerange of data to use.
  --export {none,trades,signals}
                        Export backtest results (default: trades).
  --backtest-filename, --export-filename PATH
                        Use this filename for backtest results.Example:
                        `--backtest-
                        filename=backtest_results_2020-09-27_16-20-48.json`.
                        Assumes either `user_data/backtest_results/` or
                        `--export-directory` as base directory.
  --db-url PATH         Override trades database URL, this is useful in custom
                        deployments (default: `sqlite:///tradesv3.sqlite` for
                        Live Run mode, `sqlite:///tradesv3.dryrun.sqlite` for
                        Dry Run).
  --trade-source {DB,file}
                        Specify the source for trades (Can be DB or file
                        (backtest file)) Default: file
  -i, --timeframe TIMEFRAME
                        Specify timeframe (`1m`, `5m`, `30m`, `1h`, `1d`).
  --auto-open           Automatically open generated plot.

Common arguments:
  -v, --verbose         Verbose mode (-vv for more, -vvv to get all messages).
  --no-color            Disable colorization of hyperopt results. May be
                        useful if you are redirecting output to a file.
  --logfile, --log-file FILE
                        Log to the file specified. Special values are:
                        'syslog', 'journald'. See the documentation for more
                        details.
  -V, --version         show program's version number and exit
  -c, --config PATH     Specify configuration file (default:
                        `userdir/config.json` or `config.json` whichever
                        exists). Multiple --config options may be used. Can be
                        set to `-` to read config from stdin.
  -d, --datadir, --data-dir PATH
                        Path to the base directory of the exchange with
                        historical backtesting data. To see futures data, use
                        trading-mode additionally.
  --userdir, --user-data-dir PATH
                        Path to userdata directory.

Strategy arguments:
  -s, --strategy NAME   Specify strategy class name which will be used by the
                        bot.
  --strategy-path PATH  Specify additional strategy lookup path.
  --recursive-strategy-search
                        Recursively search for a strategy in the strategies
                        folder.
  --freqaimodel NAME    Specify a custom freqaimodels.
  --freqaimodel-path PATH
                        Specify additional lookup path for freqaimodels.
-p/--pairs 参数可用于限制参与此计算的交易对。
示例:
使用自定义的回测导出文件
freqtrade plot-profit -p LTC/BTC --export-filename user_data/backtest_results/backtest-result.json
使用自定义数据库
freqtrade plot-profit -p LTC/BTC --db-url sqlite:///tradesv3.sqlite --trade-source DB
freqtrade --datadir user_data/data/binance_save/ plot-profit -p LTC/BTC