
特征工程
定义特征
低层级的特征工程在用户策略中的 feature_engineering_* 系列函数中完成。这些函数用于设置诸如 RSI、MFI、EMA、SMA、一天中的时间、交易量等 基础特征。这些 基础特征 可以是自定义指标,也可以来自任何你能找到的技术分析库。FreqAI 提供了一组函数来简化大规模特征工程的快速实现:
| 函数 | 描述 |
|---|---|
feature_engineering_expand_all() |
该可选函数会根据配置中定义的 indicator_periods_candles、include_timeframes、include_shifted_candles 和 include_corr_pairs 自动扩展已定义的特征。 |
feature_engineering_expand_basic() |
该可选函数会根据配置中定义的 include_timeframes、include_shifted_candles 和 include_corr_pairs 自动扩展已定义的特征。注意:此函数 不会 在 indicator_periods_candles 上进行扩展。 |
feature_engineering_standard() |
该可选函数会在基础时间帧的数据框上被调用一次。这是最后被调用的函数,意味着传入该函数的数据框将包含由其他 feature_engineering_expand 函数创建的所有基础资产特征和列。此函数适合进行自定义的高级特征提取(例如 tsfresh),也适合处理那些不应被自动扩展的特征(例如星期几)。 |
set_freqai_targets() |
设置模型目标的必需函数。所有目标必须以 & 开头,才能被 FreqAI 内部机制识别。 |
同时,高层级的特征工程在 FreqAI 配置文件的 "feature_parameters":{} 中处理。在此部分可以决定基于 基础特征 的大规模特征扩展,例如“包含相关交易对”、“包含有用的时间帧”或“包含最近的 K 线”。
建议从源码提供的示例策略中的模板 feature_engineering_* 函数开始(位于 templates/FreqaiExampleStrategy.py),以确保特征定义遵循正确的规范。以下是如何在策略中设置指标和标签的示例:
    def feature_engineering_expand_all(self, dataframe: DataFrame, period, metadata, **kwargs) -> DataFrame:
        """
        *Only functional with FreqAI enabled strategies*
        This function will automatically expand the defined features on the config defined
        `indicator_periods_candles`, `include_timeframes`, `include_shifted_candles`, and
        `include_corr_pairs`. In other words, a single feature defined in this function
        will automatically expand to a total of
        `indicator_periods_candles` * `include_timeframes` * `include_shifted_candles` *
        `include_corr_pairs` numbers of features added to the model.

        All features must be prepended with `%` to be recognized by FreqAI internals.

        Access metadata such as the current pair/timeframe/period with:

        `metadata["pair"]` `metadata["tf"]`  `metadata["period"]`

        :param df: strategy dataframe which will receive the features
        :param period: period of the indicator - usage example:
        :param metadata: metadata of current pair
        dataframe["%-ema-period"] = ta.EMA(dataframe, timeperiod=period)
        """

        dataframe["%-rsi-period"] = ta.RSI(dataframe, timeperiod=period)
        dataframe["%-mfi-period"] = ta.MFI(dataframe, timeperiod=period)
        dataframe["%-adx-period"] = ta.ADX(dataframe, timeperiod=period)
        dataframe["%-sma-period"] = ta.SMA(dataframe, timeperiod=period)
        dataframe["%-ema-period"] = ta.EMA(dataframe, timeperiod=period)

        bollinger = qtpylib.bollinger_bands(
            qtpylib.typical_price(dataframe), window=period, stds=2.2
        )
        dataframe["bb_lowerband-period"] = bollinger["lower"]
        dataframe["bb_middleband-period"] = bollinger["mid"]
        dataframe["bb_upperband-period"] = bollinger["upper"]

        dataframe["%-bb_width-period"] = (
            dataframe["bb_upperband-period"]
            - dataframe["bb_lowerband-period"]
        ) / dataframe["bb_middleband-period"]
        dataframe["%-close-bb_lower-period"] = (
            dataframe["close"] / dataframe["bb_lowerband-period"]
        )

        dataframe["%-roc-period"] = ta.ROC(dataframe, timeperiod=period)

        dataframe["%-relative_volume-period"] = (
            dataframe["volume"] / dataframe["volume"].rolling(period).mean()
        )

        return dataframe

    def feature_engineering_expand_basic(self, dataframe: DataFrame, metadata, **kwargs) -> DataFrame:
        """
        *Only functional with FreqAI enabled strategies*
        This function will automatically expand the defined features on the config defined
        `include_timeframes`, `include_shifted_candles`, and `include_corr_pairs`.
        In other words, a single feature defined in this function
        will automatically expand to a total of
        `include_timeframes` * `include_shifted_candles` * `include_corr_pairs`
        numbers of features added to the model.

        Features defined here will *not* be automatically duplicated on user defined
        `indicator_periods_candles`

        Access metadata such as the current pair/timeframe with:

        `metadata["pair"]` `metadata["tf"]`

        All features must be prepended with `%` to be recognized by FreqAI internals.

        :param df: strategy dataframe which will receive the features
        :param metadata: metadata of current pair
        dataframe["%-pct-change"] = dataframe["close"].pct_change()
        dataframe["%-ema-200"] = ta.EMA(dataframe, timeperiod=200)
        """
        dataframe["%-pct-change"] = dataframe["close"].pct_change()
        dataframe["%-raw_volume"] = dataframe["volume"]
        dataframe["%-raw_price"] = dataframe["close"]
        return dataframe

    def feature_engineering_standard(self, dataframe: DataFrame, metadata, **kwargs) -> DataFrame:
        """
        *Only functional with FreqAI enabled strategies*
        This optional function will be called once with the dataframe of the base timeframe.
        This is the final function to be called, which means that the dataframe entering this
        function will contain all the features and columns created by all other
        freqai_feature_engineering_* functions.

        This function is a good place to do custom exotic feature extractions (e.g. tsfresh).
        This function is a good place for any feature that should not be auto-expanded upon
        (e.g. day of the week).

        Access metadata such as the current pair with:

        `metadata["pair"]`

        All features must be prepended with `%` to be recognized by FreqAI internals.

        :param df: strategy dataframe which will receive the features
        :param metadata: metadata of current pair
        usage example: dataframe["%-day_of_week"] = (dataframe["date"].dt.dayofweek + 1) / 7
        """
        dataframe["%-day_of_week"] = (dataframe["date"].dt.dayofweek + 1) / 7
        dataframe["%-hour_of_day"] = (dataframe["date"].dt.hour + 1) / 25
        return dataframe

    def set_freqai_targets(self, dataframe: DataFrame, metadata, **kwargs) -> DataFrame:
        """
        *Only functional with FreqAI enabled strategies*
        Required function to set the targets for the model.
        All targets must be prepended with `&` to be recognized by the FreqAI internals.

        Access metadata such as the current pair with:

        `metadata["pair"]`

        :param df: strategy dataframe which will receive the targets
        :param metadata: metadata of current pair
        usage example: dataframe["&-target"] = dataframe["close"].shift(-1) / dataframe["close"]
        """
        dataframe["&-s_close"] = (
            dataframe["close"]
            .shift(-self.freqai_info["feature_parameters"]["label_period_candles"])
            .rolling(self.freqai_info["feature_parameters"]["label_period_candles"])
            .mean()
            / dataframe["close"]
            - 1
            )

        return dataframe
在上述示例中,用户不希望将 bb_lowerband 作为特征传递给模型,因此未在其前面添加 %。然而,用户希望将 bb_width 传递给模型用于训练/预测,因此在其前面添加了 %。
定义完基础特征后,下一步是使用配置文件中的强大功能feature_parameters对其进行扩展:
    "freqai": {
        //...
        "feature_parameters" : {
            "include_timeframes": ["5m","15m","4h"],
            "include_corr_pairlist": [
                "ETH/USD",
                "LINK/USD",
                "BNB/USD"
            ],
            "label_period_candles": 24,
            "include_shifted_candles": 2,
            "indicator_periods_candles": [10, 20]
        },
        //...
    }
上述配置中的 include_timeframes 表示策略中每次调用 feature_engineering_expand_*() 时对应的时间周期(tf)。在当前示例中,用户要求将 rsi、mfi、roc 和 bb_width 在 5m、15m 和 4h 时间周期上的数据包含进特征集中。
你可以通过 include_corr_pairlist 指定是否将已定义的每个特征也包含到相关交易对中。这意味着特征集将包含配置中定义的各个相关交易对(如本例中的 ETH/USD、LINK/USD 和 BNB/USD)在所有 include_timeframes 上通过 feature_engineering_expand_*() 生成的全部特征。
include_shifted_candles 表示要包含在特征集中的历史 K 线数量。例如,include_shifted_candles: 2 表示 FreqAI 应为特征集中的每个特征包含过去两根 K 线的数据。
总体而言,该示例策略的用户所创建的特征总数为:include_timeframes 的长度 × feature_engineering_expand_*() 中的特征数量 × include_corr_pairlist 的长度 × include_shifted_candles 的数量 × indicator_periods_candles 的长度 \(= 3 * 3 * 3 * 2 * 2 = 108\)。
了解更多关于创造性特征工程的知识
查看我们的Medium 文章,帮助用户学习如何创造性地设计特征。
使用 metadata 对 feature_engineering_* 函数进行更精细的控制
所有 feature_engineering_* 和 set_freqai_targets() 函数都会接收到一个 metadata 字典,其中包含 FreqAI 正在为其自动化构建特征的交易对(pair)、时间周期(tf)和周期(period)等信息。因此,用户可以在 feature_engineering_* 函数内部使用 metadata 作为条件,来限制或保留特定时间周期、周期或交易对的特征。
def feature_engineering_expand_all(self, dataframe: DataFrame, period, metadata, **kwargs) -> DataFrame:
    if metadata["tf"] == "1h":
        dataframe["%-roc-period"] = ta.ROC(dataframe, timeperiod=period)
这将阻止 ta.ROC() 被添加到除 "1h" 以外的任何时间周期中。
从训练过程中返回额外信息
重要的指标可以在每次模型训练结束时通过在自定义预测模型类中设置 dk.data['extra_returns_per_train']['my_new_value'] = XYZ 返回给策略。
FreqAI 会将字典中分配的 my_new_value 扩展以匹配返回给策略的数据帧。之后你就可以在策略中通过 dataframe['my_new_value'] 使用这些返回的指标。FreqAI 中返回值的一个使用示例是 &*_mean 和 &*_std 值,它们被用来创建动态目标阈值。
另一个示例展示了用户希望从交易数据库中使用实时指标,如下所示:
    "freqai": {
        "extra_returns_per_train": {"total_profit": 4}
    }
你需要在配置文件中设置标准字典,以便 FreqAI 能够返回正确的数据框形状。这些值可能会被预测模型覆盖,但在模型尚未设置它们或需要默认初始值的情况下,将返回预设的值。
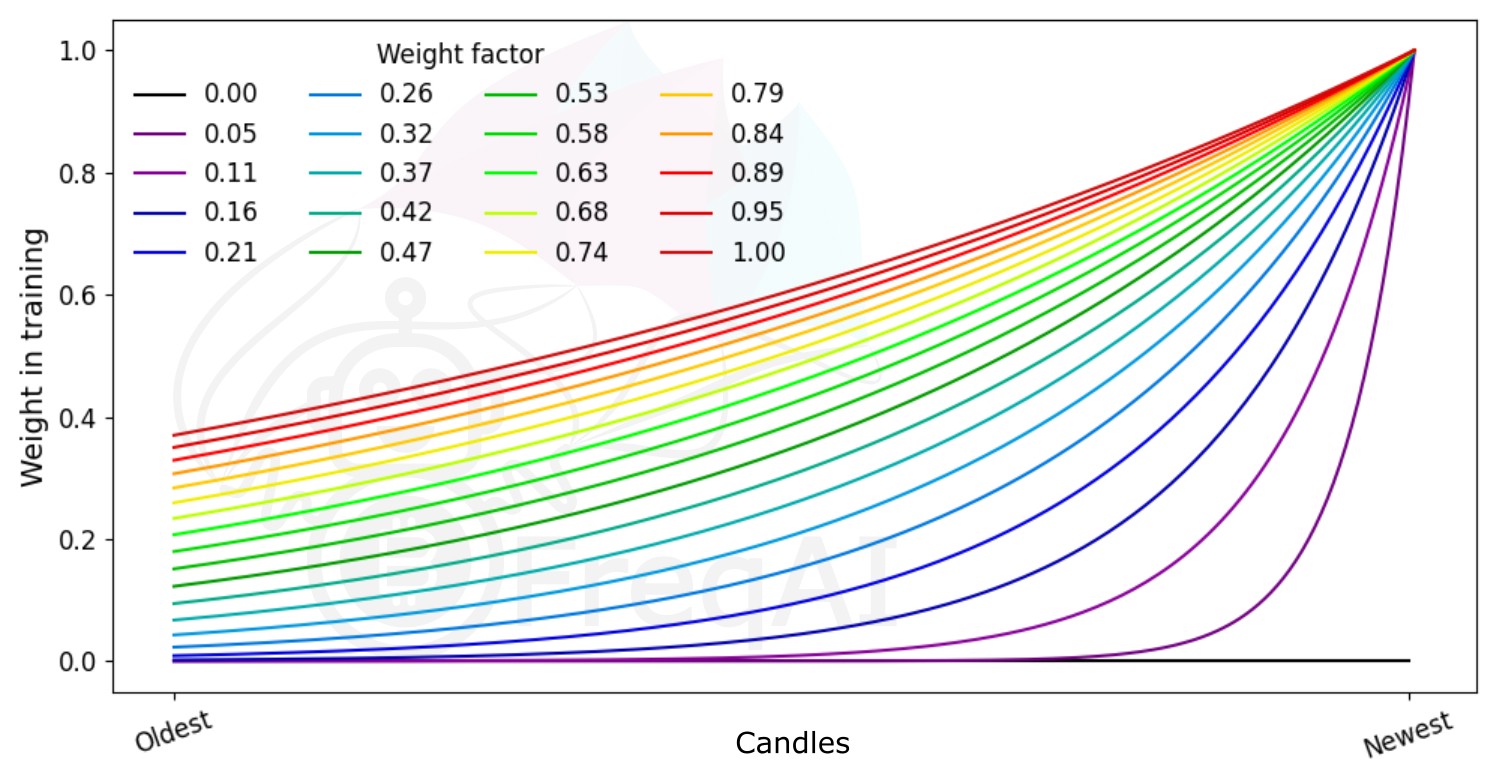
为特征的时间重要性加权
FreqAI 允许你通过指数函数设置 weight_factor,以使近期数据比历史数据具有更高的权重:
其中 \(W_i\) 表示在总共 \(n\) 个数据点中,第 \(i\) 个数据点的权重。下图展示了不同权重因子对特征集中各数据点的影响。
构建数据流水线
默认情况下,FreqAI 会根据用户的配置设置构建一个动态流水线。默认设置具备良好的鲁棒性,并设计为可与多种方法协同工作。这两个默认步骤分别是 MinMaxScaler(-1,1) 和 VarianceThreshold,后者会移除所有方差为 0 的列。用户可以通过更多配置参数激活其他步骤。例如,如果用户在 freqai 配置中添加 use_SVM_to_remove_outliers: true,则 FreqAI 将自动向流水线中添加 SVMOutlierExtractor。同样,用户可以在 freqai 配置中添加 principal_component_analysis: true 来启用 PCA。通过设置 DI_threshold: 1 可激活 DissimilarityIndex。此外,还可以通过 noise_standard_deviation: 0.1 向数据中添加噪声。最后,用户可通过设置 use_DBSCAN_to_remove_outliers: true 添加基于 DBSCAN 的异常值剔除功能。
更多信息请参阅
请查看参数表以获取有关这些参数的更多详细信息。
自定义流水线
鼓励用户根据自身需求自定义数据流水线。这可以通过构建自己的数据流水线来实现。只需在 IFreqaiModel 的 train() 函数内将 dk.feature_pipeline 设置为所需的 Pipeline 对象即可;或者,如果你更倾向于不修改 train() 函数,也可以在你的 IFreqaiModel 中重写 define_data_pipeline/define_label_pipeline 方法:
更多信息请参阅
FreqAI 使用 DataSieve 流水线,该流水线遵循 SKlearn 流水线 API,同时增加了其他特性,例如 X、y 和 sample_weight 向量在数据点剔除时的一致性、特征剔除以及特征名称追踪。
from datasieve.transforms import SKLearnWrapper, DissimilarityIndex
from datasieve.pipeline import Pipeline
from sklearn.preprocessing import QuantileTransformer, StandardScaler
from freqai.base_models import BaseRegressionModel


class MyFreqaiModel(BaseRegressionModel):
    """
    Some cool custom model
    """
    def fit(self, data_dictionary: Dict, dk: FreqaiDataKitchen, **kwargs) -> Any:
        """
        My custom fit function
        """
        model = cool_model.fit()
        return model

    def define_data_pipeline(self) -> Pipeline:
        """
        User defines their custom feature pipeline here (if they wish)
        """
        feature_pipeline = Pipeline([
            ('qt', SKLearnWrapper(QuantileTransformer(output_distribution='normal'))),
            ('di', ds.DissimilarityIndex(di_threshold=1))
        ])

        return feature_pipeline

    def define_label_pipeline(self) -> Pipeline:
        """
        User defines their custom label pipeline here (if they wish)
        """
        label_pipeline = Pipeline([
            ('qt', SKLearnWrapper(StandardScaler())),
        ])

        return label_pipeline
在这里,你正在明确定义训练和预测期间用于特征集的完整流水线。你可以通过上文所示的 SKLearnWrapper 类封装的方式,使用大多数 SKLearn 变换步骤。此外,你还可以使用 DataSieve 库 中提供的任意变换。
你可以通过创建一个继承自 DataSieve 的 BaseTransform 类的自定义类,并实现其 fit()、transform() 和 inverse_transform() 方法,轻松添加自己的变换:
from datasieve.transforms.base_transform import BaseTransform
# import whatever else you need

class MyCoolTransform(BaseTransform):
    def __init__(self, **kwargs):
        self.param1 = kwargs.get('param1', 1)

    def fit(self, X, y=None, sample_weight=None, feature_list=None, **kwargs):
        # do something with X, y, sample_weight, or/and feature_list
        return X, y, sample_weight, feature_list

    def transform(self, X, y=None, sample_weight=None,
                  feature_list=None, outlier_check=False, **kwargs):
        # do something with X, y, sample_weight, or/and feature_list
        return X, y, sample_weight, feature_list

    def inverse_transform(self, X, y=None, sample_weight=None, feature_list=None, **kwargs):
        # do/dont do something with X, y, sample_weight, or/and feature_list
        return X, y, sample_weight, feature_list
提示
你可以在与 IFreqaiModel 相同的文件中定义这个自定义类。
将自定义的 IFreqaiModel 迁移到新管道
如果你创建了自定义的 IFreqaiModel,并实现了自定义的 train()/predict() 方法,并且仍然依赖 data_cleaning_train/predict(),那么你需要迁移到新的管道系统。如果你的模型不依赖 data_cleaning_train/predict(),则无需担心此次迁移。
有关迁移的更多详细信息,请参见此处。
异常值检测
股票和加密货币市场常受到大量非模式化噪声的影响,表现为异常数据点。FreqAI 提供了多种方法来识别此类异常值,从而降低风险。
使用差异性指数(DI)识别异常值
差异性指数(DI)旨在量化模型每次预测所关联的不确定性。
你可以在配置中加入以下语句,指示 FreqAI 使用 DI 从训练/测试数据集中移除异常数据点:
    "freqai": {
        "feature_parameters" : {
            "DI_threshold": 1
        }
    }
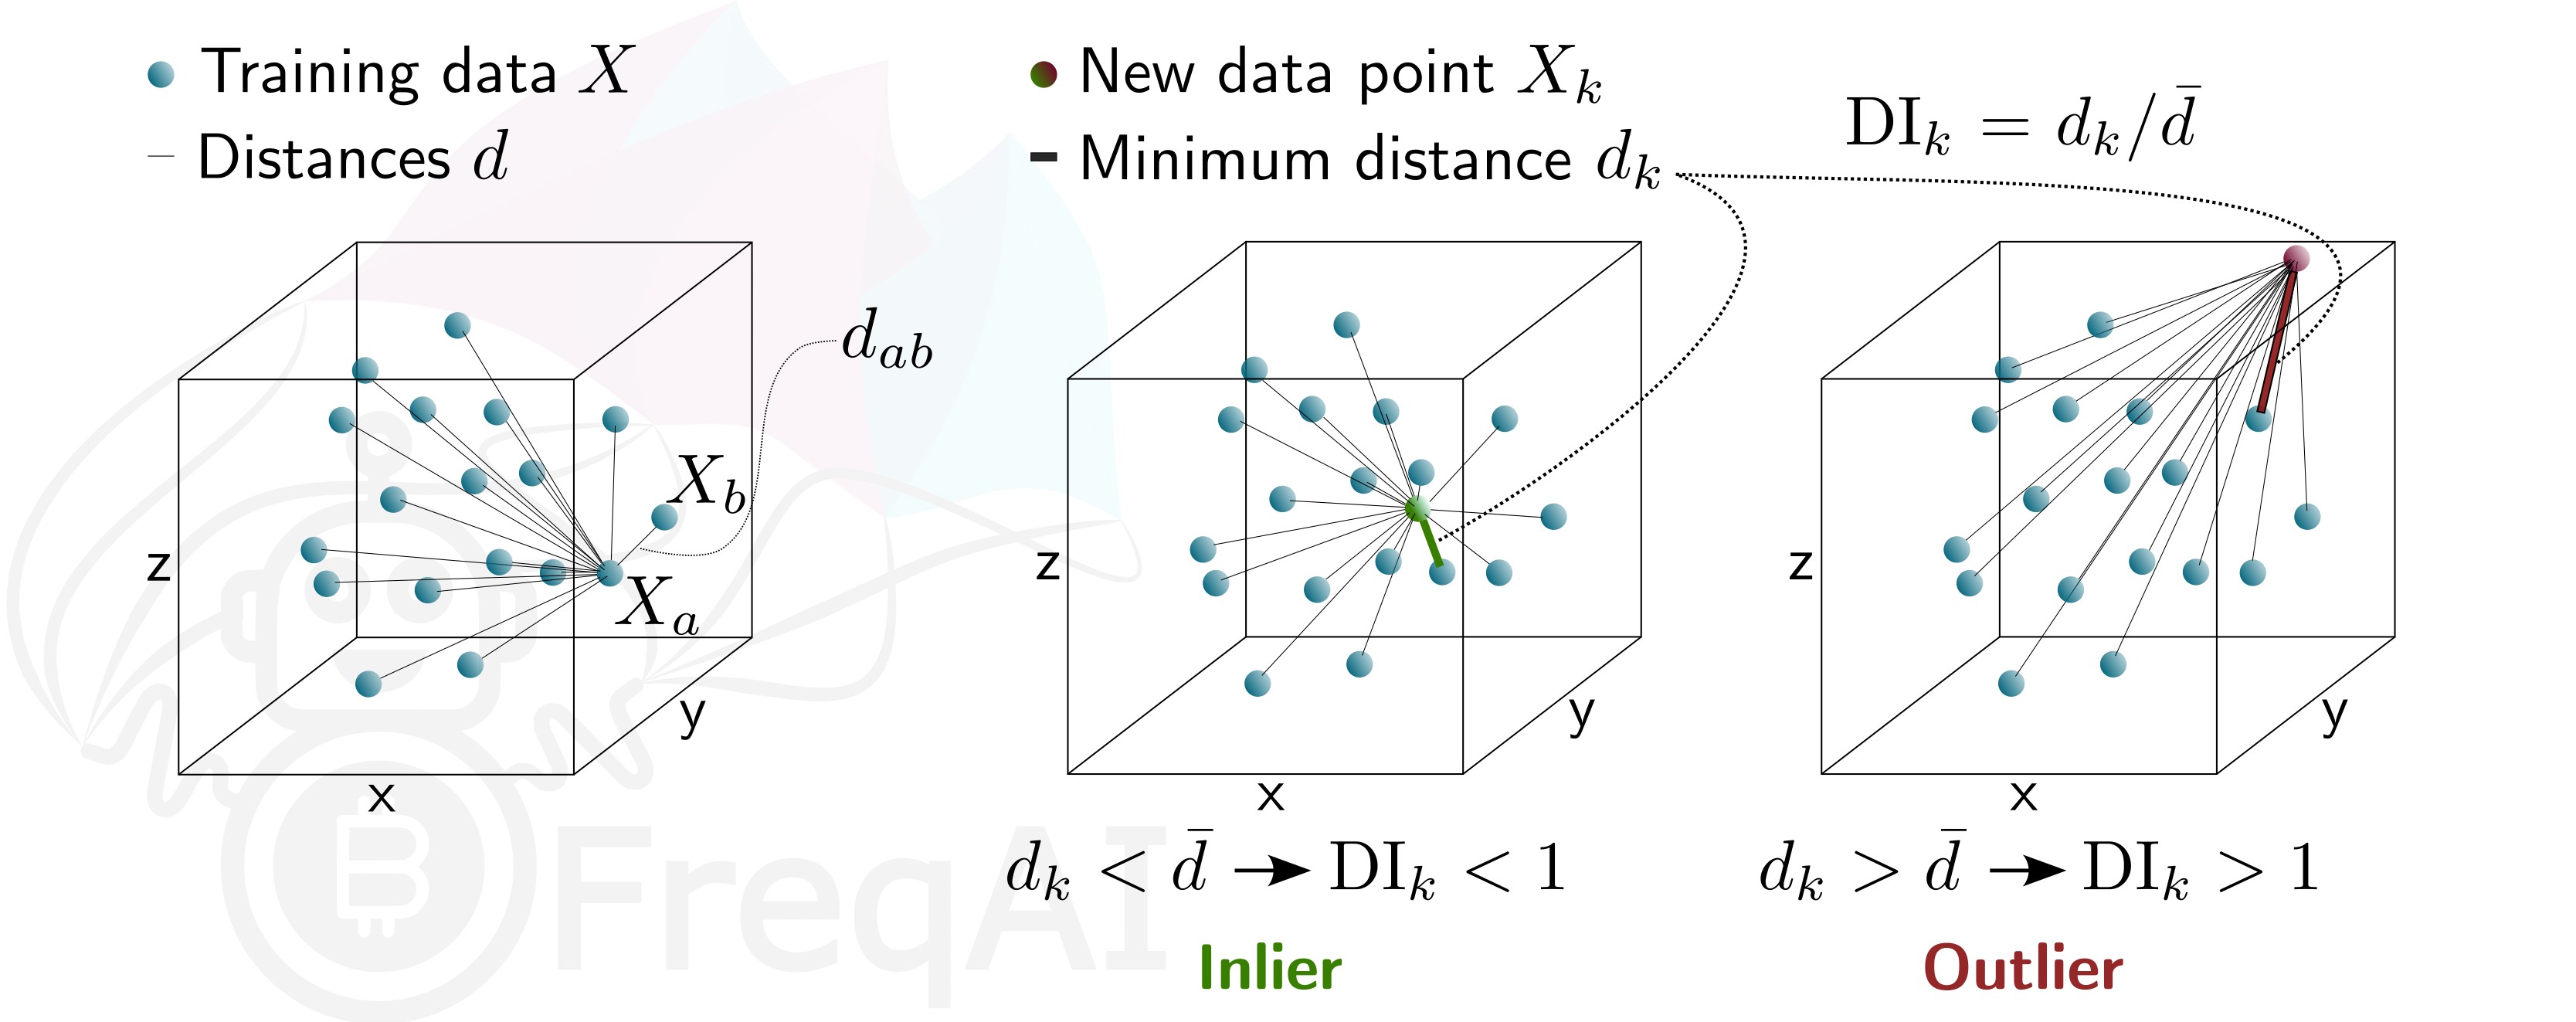
这会将 DissimilarityIndex 步骤添加到你的 feature_pipeline 中,并将阈值设为 1。DI 可以排除那些属于异常值(在模型特征空间中不存在)且置信度较低的预测。为此,FreqAI 会测量每个训练数据点(特征向量)\(X_{a}\) 与其他所有训练数据点之间的距离:
其中 \(d_{ab}\) 表示归一化后的点 \(a\) 与 \(b\) 之间的距离,\(p\) 是特征数量,即向量 \(X\) 的长度。一组训练数据点的特征距离 \(\overline{d}\) 就是平均距离的均值:
\(\overline{d}\) 用于量化训练数据的分布范围,并与新预测特征向量 \(X_k\) 与所有训练数据之间的距离进行比较:
从而可以估计出差异性指数(DI):
你可以通过调整 DI_threshold 来控制模型外推的程度。DI_threshold 越高,表示 DI 更宽松,允许距离训练数据更远的预测被使用;而较低的 DI_threshold 则起到相反作用,会丢弃更多的预测结果。
下图展示了三维数据集的 DI 情况。
使用支持向量机(SVM)识别异常值
你可以在配置中加入以下语句,指示 FreqAI 使用支持向量机(SVM)从训练/测试数据集中移除异常数据点:
    "freqai": {
        "feature_parameters" : {
            "use_SVM_to_remove_outliers": true
        }
    }
这会将 SVMOutlierExtractor 步骤添加到你的 feature_pipeline 中。SVM 将在训练数据上进行训练,任何被 SVM 判定为超出特征空间的数据点都将被移除。
你可以选择在配置文件的 feature_parameters.svm_params 字典中为 SVM 提供额外参数,例如 shuffle 和 nu。
参数 shuffle 默认设置为 False,以确保结果的一致性。如果将其设置为 True,由于 max_iter 设置过低,导致算法无法达到所需的 tol 值,因此在相同数据集上多次运行 SVM 可能会产生不同的结果。增加 max_iter 可以解决此问题,但会使过程耗时更长。
参数 nu 大致表示应被视为离群值的数据点比例,其取值应在 0 到 1 之间。
使用 DBSCAN 识别离群值
你可以在配置中启用 use_DBSCAN_to_remove_outliers,让 FreqAI 使用 DBSCAN 对训练/测试数据集或预测中的新进数据进行聚类并移除离群值:
    "freqai": {
        "feature_parameters" : {
            "use_DBSCAN_to_remove_outliers": true
        }
    }
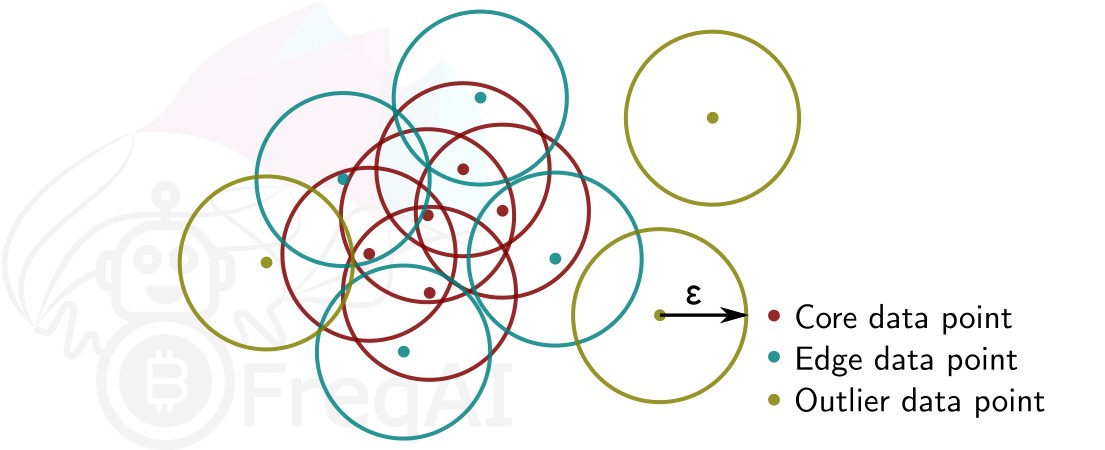
这会将 DataSieveDBSCAN 步骤添加到你的 feature_pipeline 中。这是一种无监督的机器学习算法,能够在不需要预先知道聚类数量的情况下对数据进行聚类。
给定一个数据点数量 \(N\) 和距离 \(\varepsilon\),DBSCAN 通过将所有在距离 \(\varepsilon\) 内拥有至少 \(N-1\) 个其他数据点的数据点标记为核心点来对数据集进行聚类。若一个数据点位于某个核心点的距离 \(\varepsilon\) 范围内,但其自身周围距离 \(\varepsilon\) 内的数据点少于 \(N-1\) 个,则该点被视为边缘点。一个聚类即由核心点和边缘点组成。没有任何其他数据点在其距离 \(<\varepsilon\) 范围内的数据点被视为离群值。下图展示了一个 \(N = 3\) 的聚类示例。
FreqAI 使用 sklearn.cluster.DBSCAN(详细信息可在 scikit-learn 官网 此处(外部网站)查看),其中 min_samples(\(N\))取特征集中时间点(蜡烛图)数量的 ¼。eps(\(\varepsilon\))则通过计算特征集中所有数据点成对距离的最近邻得到的 k-距离图 中的肘部点自动确定。
使用主成分分析(PCA)进行数据降维
你可以在配置中启用 principal_component_analysis 来降低特征的维度:
    "freqai": {
        "feature_parameters" : {
            "principal_component_analysis": true
        }
    }
这将对特征执行 PCA,降低其维度,使得数据集的解释方差 >= 0.999。降低数据维度可以加快模型训练速度,从而允许使用更及时更新的模型。