Matplotlib 和 Plotly 图表
Matplotlib
使用pictures.add(),将Matplotlib图作为图片粘贴到Excel中非常容易。
入门指南
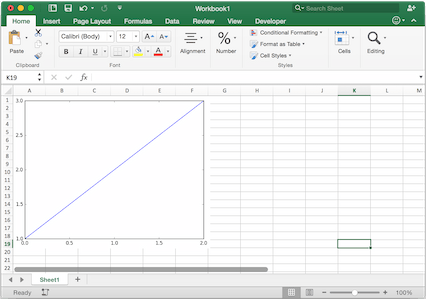
最简单的示例可以简化为:
import matplotlib.pyplot as plt
import xlwings as xw

fig = plt.figure()
plt.plot([1, 2, 3])

sheet = xw.Book().sheets[0]
sheet.pictures.add(fig, name='MyPlot', update=True)
注意
如果你设置update=True,则可以在Excel中调整和定位图表:后续调用pictures.add()并使用相同名称('MyPlot')会更新图片而不改变其位置或大小。
注意
如果出现以下警告UserWarning: Starting a Matplotlib GUI outside of the main thread will likely fail.,请确保在使用任何Matplotlib/Pyplot代码之前设置Matplotlib后端:import matplotlib as mpl和mpl.use("agg").
与Excel的全面集成
调用上述代码与RunPython并将其例如绑定到一个按钮上,简单且跨平台工作。
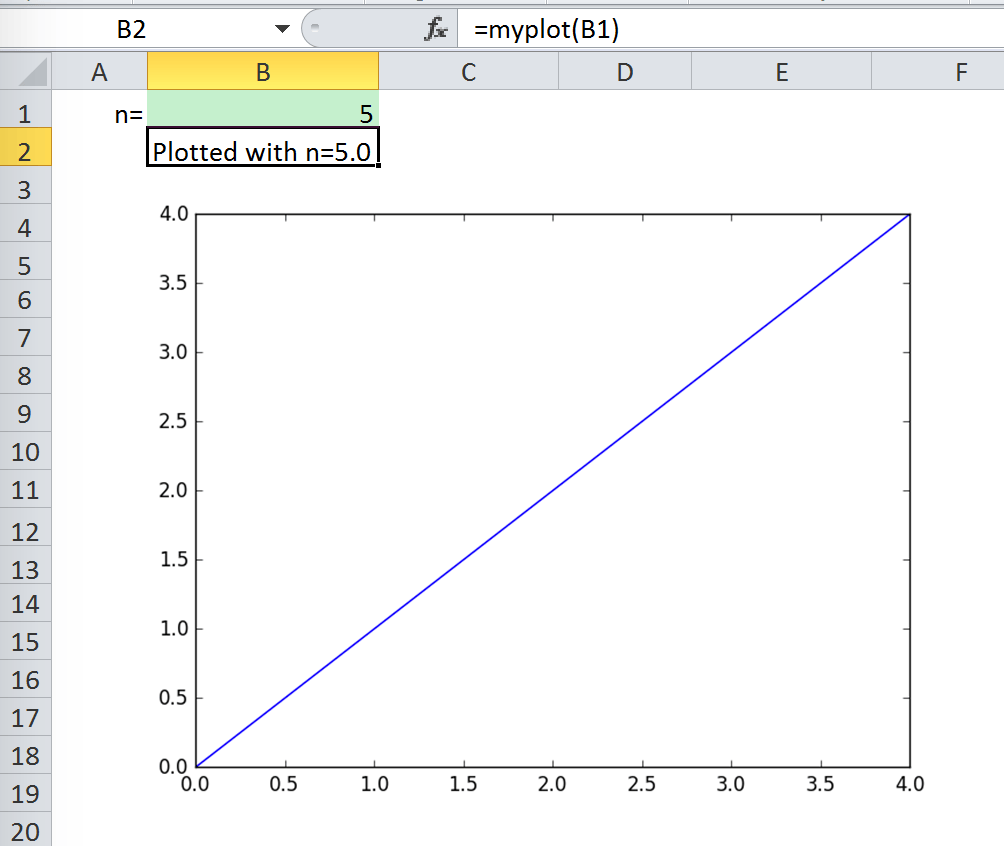
然而,在Windows上,你可以通过设置UDF来使操作更加集成,比如按以下方式:
@xw.func
def myplot(n, caller):
    fig = plt.figure()
    plt.plot(range(int(n)))
    caller.sheet.pictures.add(fig, name='MyPlot', update=True)
    return 'Plotted with n={}'.format(n)
如果你导入这个函数并从B2单元格调用它,当B1单元格发生变化时,图表会自动更新:
属性
大小、位置和其他属性可以作为参数在pictures.add()中设置,或者通过操作返回的图片对象来设置,详见xlwings.Picture().
例如:
>>> sht = xw.Book().sheets[0]
>>> sht.pictures.add(fig, name='MyPlot', update=True,
                     left=sht.range('B5').left, top=sht.range('B5').top)
或者:
>>> plot = sht.pictures.add(fig, name='MyPlot', update=True)
>>> plot.height /= 2
>>> plot.width /= 2
获取Matplotlib图形
下面是一些获取matplotlib图形的例子figure对象:
通过PyPlot接口:
import matplotlib.pyplot as plt
fig = plt.figure()
plt.plot([1, 2, 3, 4, 5])
或者:
import matplotlib.pyplot as plt
plt.plot([1, 2, 3, 4, 5])
fig = plt.gcf()
通过面向对象接口:
from matplotlib.figure import Figure
fig = Figure(figsize=(8, 6))
ax = fig.add_subplot(111)
ax.plot([1, 2, 3, 4, 5])
通过Pandas:
import pandas as pd
import numpy as np

df = pd.DataFrame(np.random.rand(10, 4), columns=['a', 'b', 'c', 'd'])
ax = df.plot(kind='bar')
fig = ax.get_figure()
注意
在使用Google Sheets时,每张图片最多可以使用1百万像素。总像素数是图形大小和dpi的函数:(宽度英寸 * dpi) * (高度英寸 * dpi)。例如,fig = plt.figure(figsize=(6, 4))使用200 dpi(默认dpi)pictures.add()时,结果为(6 * 200) * (4 * 200) = 960,000 px。要更改dpi,请提供export_options: pictures.add(fig, export_options={"bbox_inches": "tight", "dpi": 300})。现有的图形大小可以通过fig.get_size_inches()检查。pandas也接受figsize,像这样:ax = df.plot(figsize=(3, 3))注意"bbox_inches": "tight"裁剪图像并将非确定性地减少像素数量。export_options将传递给figure.figsave()当使用Matplotlib时,以及传递给figure.write_image()当使用Plotly时。
Plotly静态图表
前置条件
除了plotly,你还需要kaleido, psutil和requests。最简单的方法是通过pip获取:
$ pip install kaleido psutil requests
或者通过conda:
$ conda install -c conda-forge python-kaleido psutil requests
如何使用
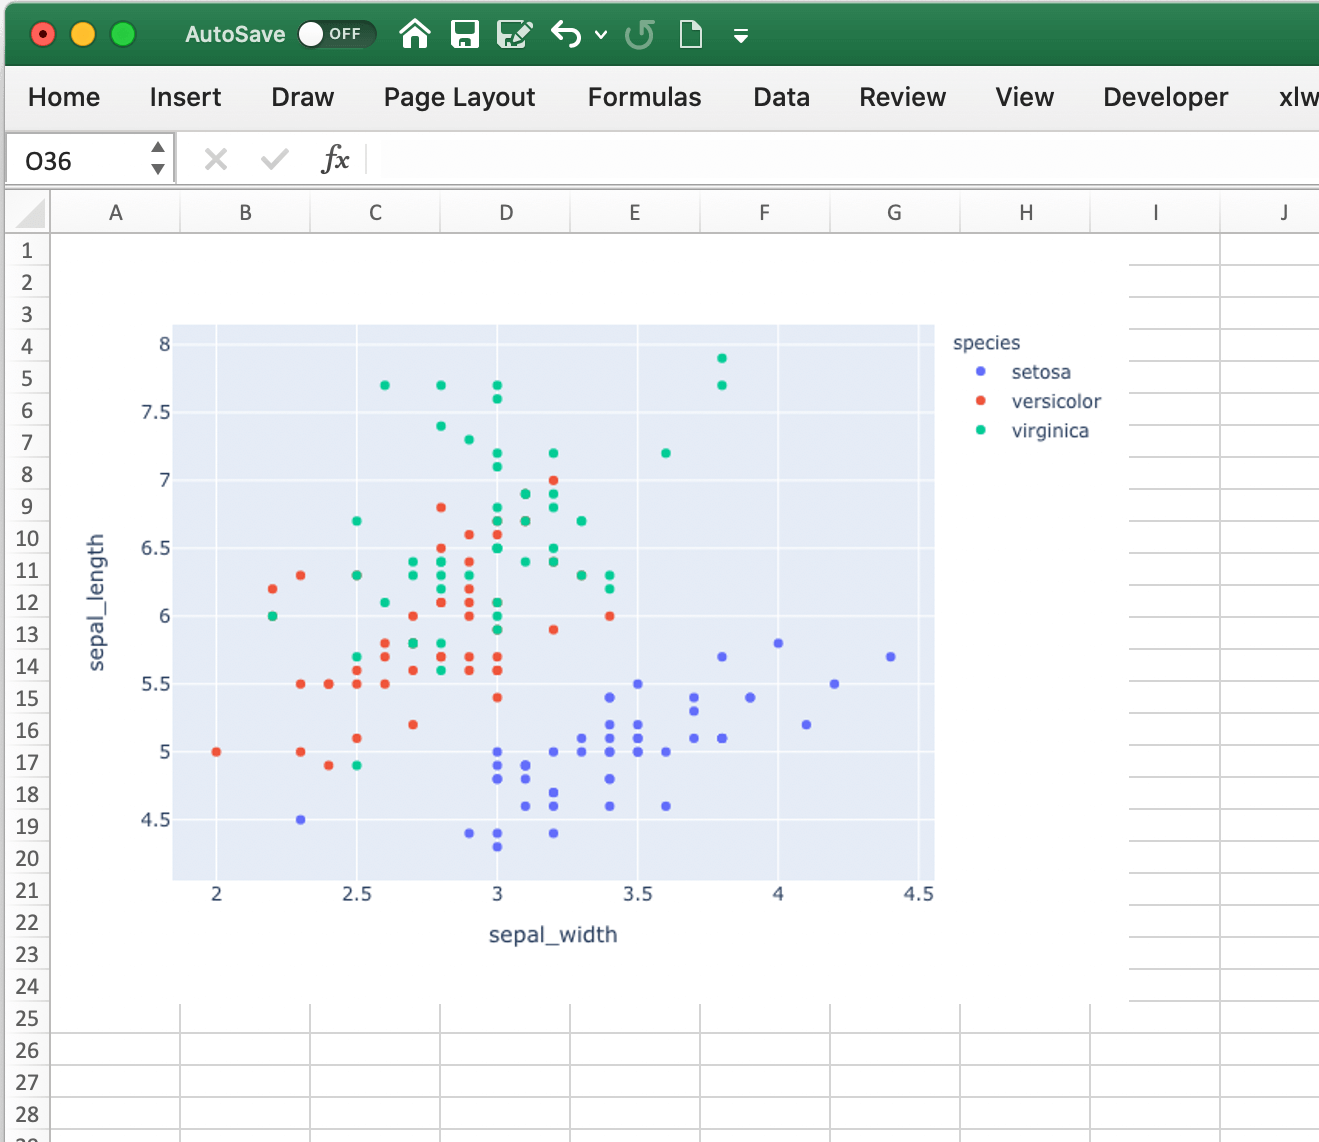
它与Matplotlib的使用方式相同,但是渲染Plotly图表需要稍微长一点的时间。这里有一个示例:
import xlwings as xw
import plotly.express as px

# Plotly chart
df = px.data.iris()
fig = px.scatter(df, x="sepal_width", y="sepal_length", color="species")

# Add it to Excel
wb = xw.Book()
wb.sheets[0].pictures.add(fig, name='IrisScatterPlot', update=True)